‘Safest Driver’ Data Reveal Where Boston’s Most Dangerous Driving Is
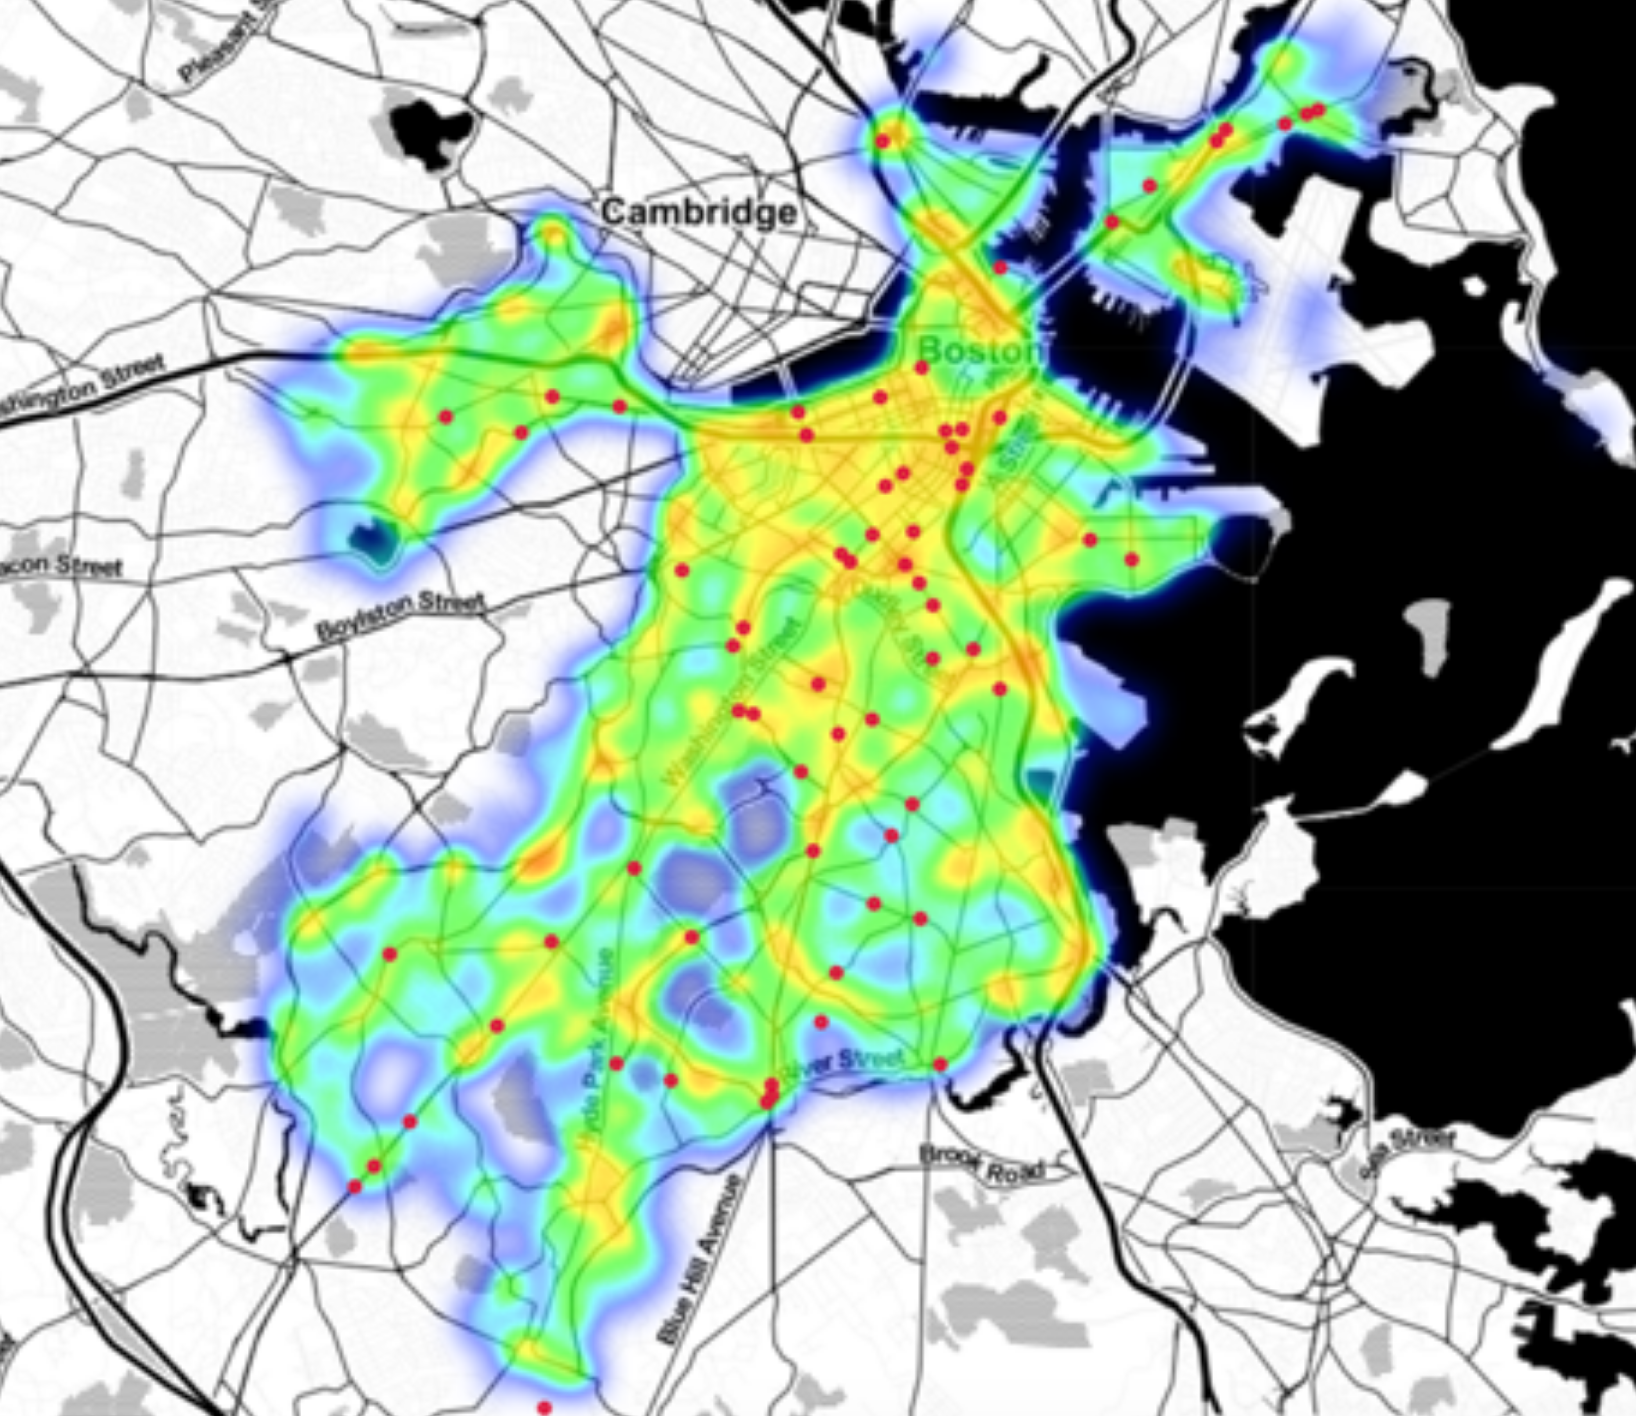
A heat map of harsh braking incidents recorded by the City of Boston’s “Safest Driver” app in 2019. Courtesy of the City of Boston.
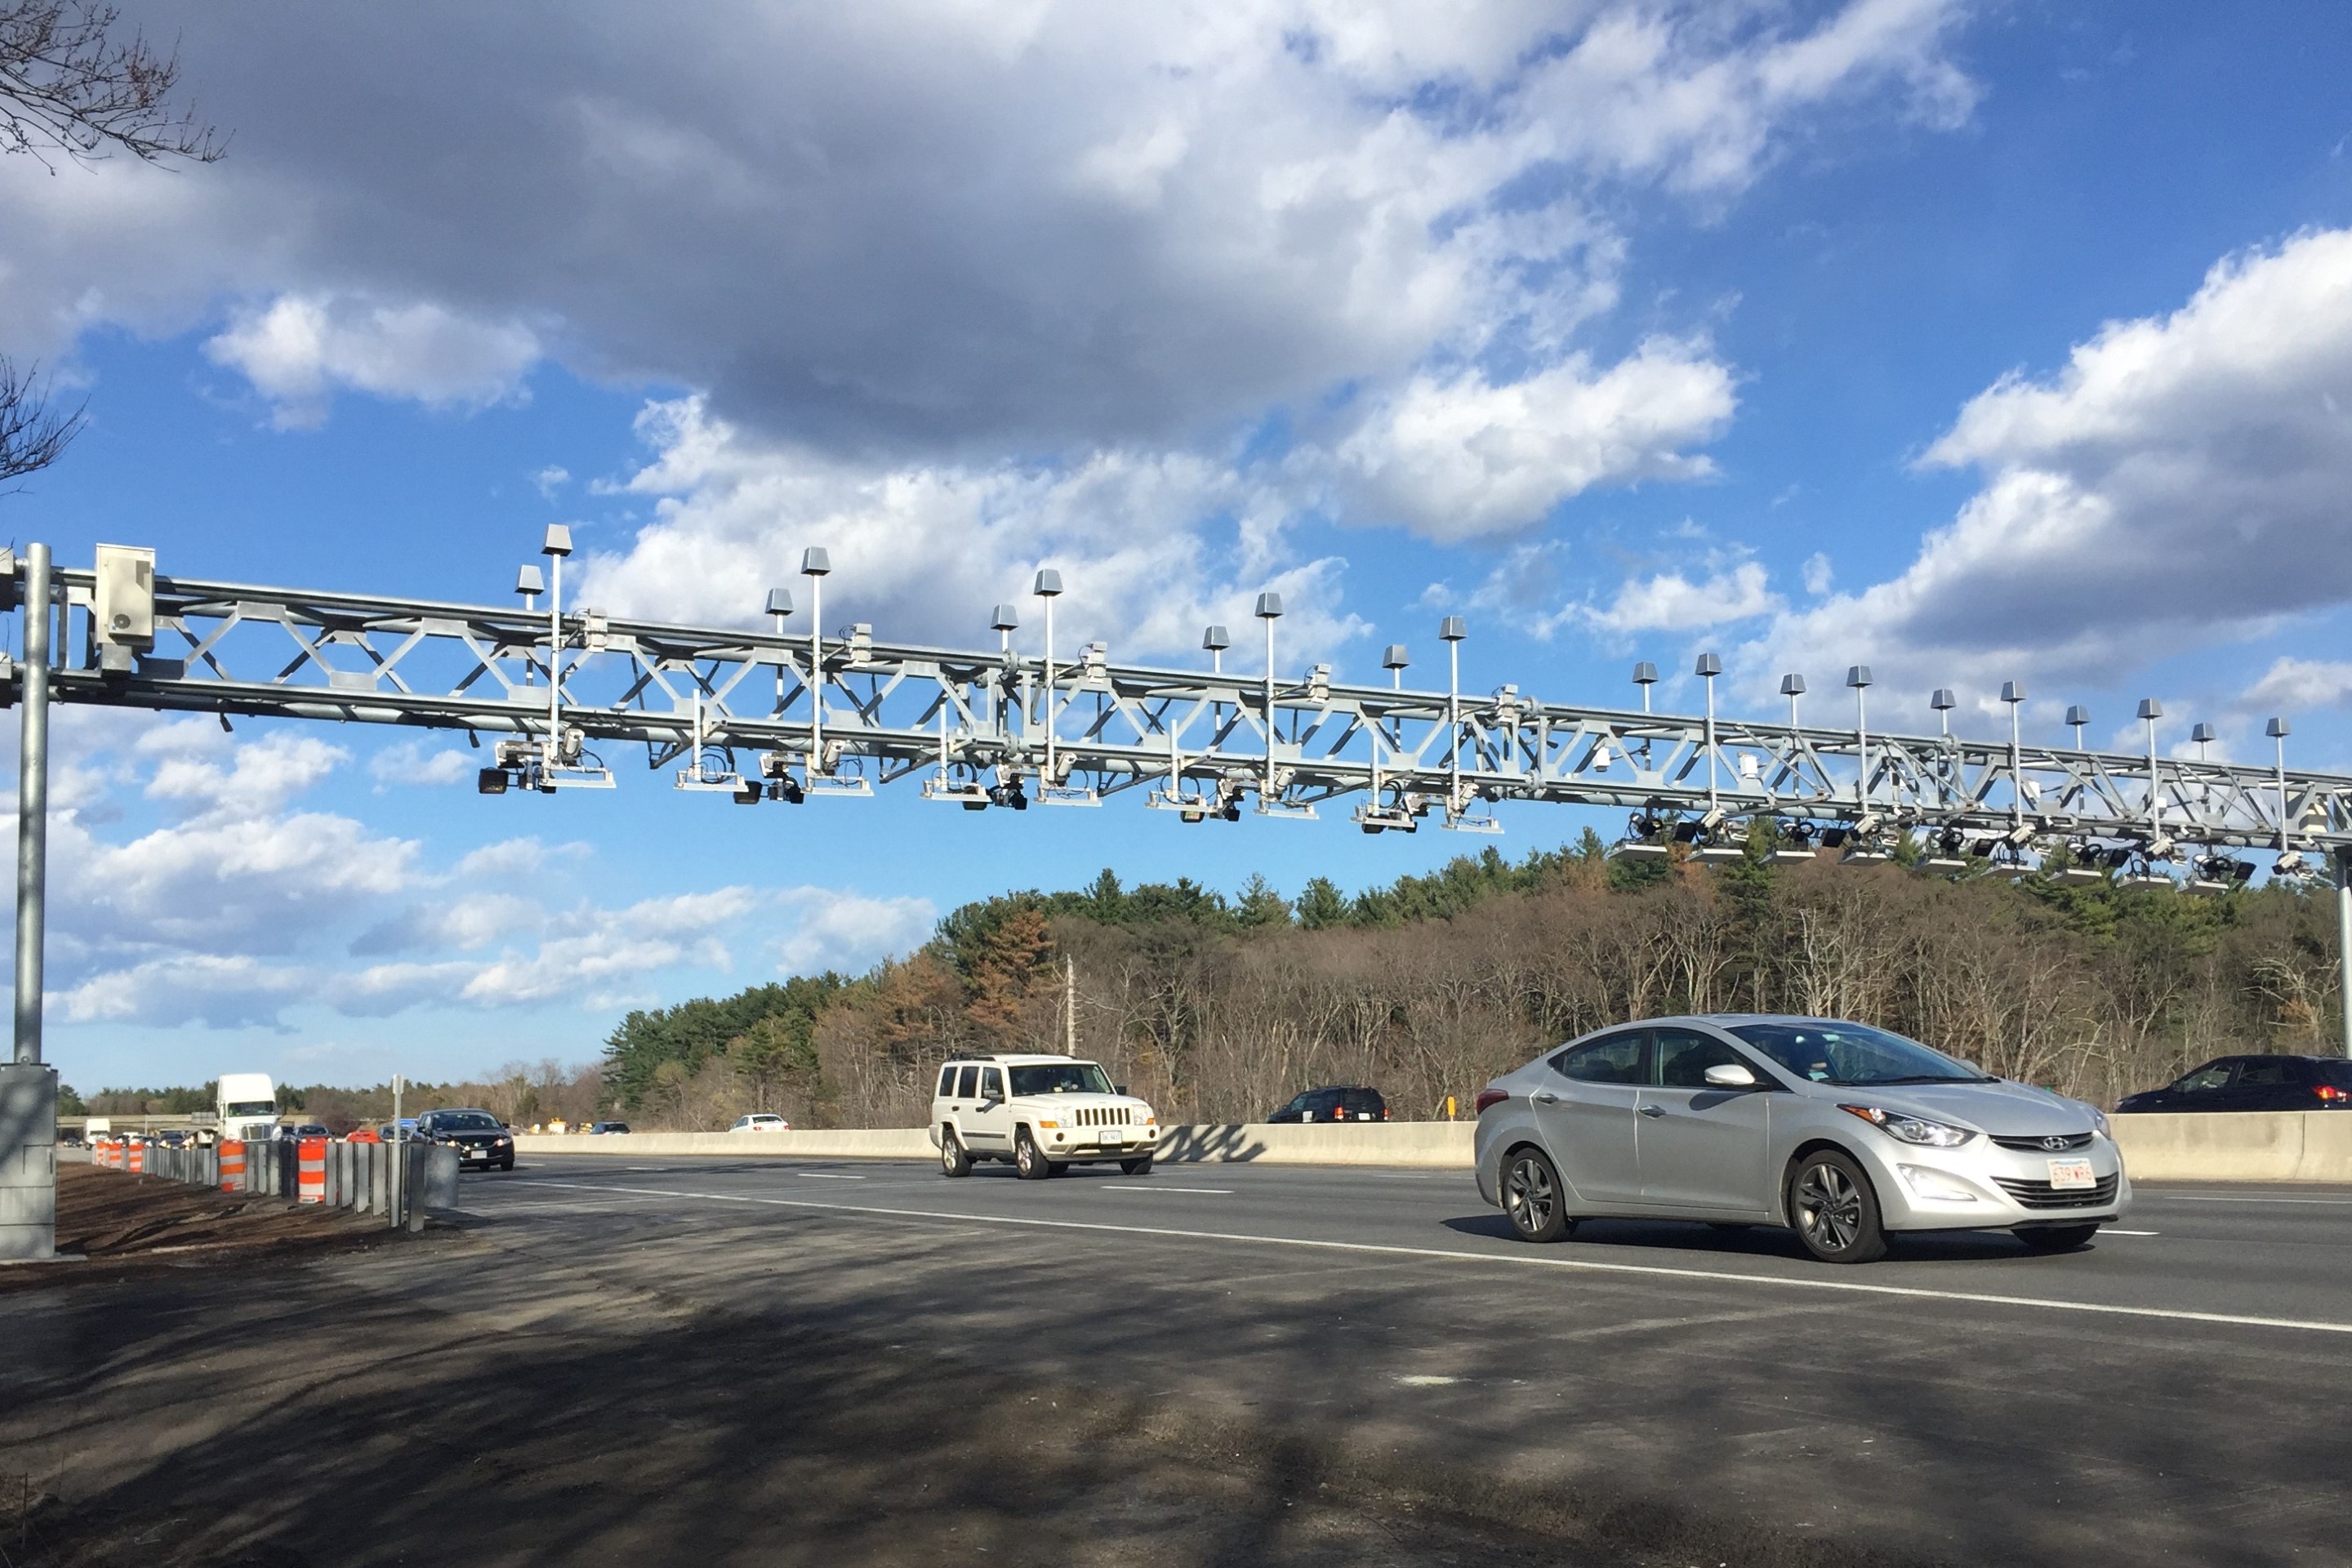
Data collected from a city-sponsored safe driving competition reveal that Boston's notoriously bad drivers are at their worst behavior on major high-speed state roadways that lie outside of the city's direct control.
In 2019, the City of Boston's Office of New Urban Mechanics re-launched its "Boston's Safest Driver" contest, an app-based competition that challenged travelers to obey speed limits and avoid distracted driving. Using its users' phone sensors, the app could detect vehicle speeds and sudden phone movements that were likely associated with harsh braking incidents or distracted driving incidents.
In addition to encouraging its users to avoid those behaviors, the app also recorded the locations where those dangerous driving incidents were occurring, so that at the end of the 12-week contest period, the city had a detailed map of where dangerous driving behavior was most common.
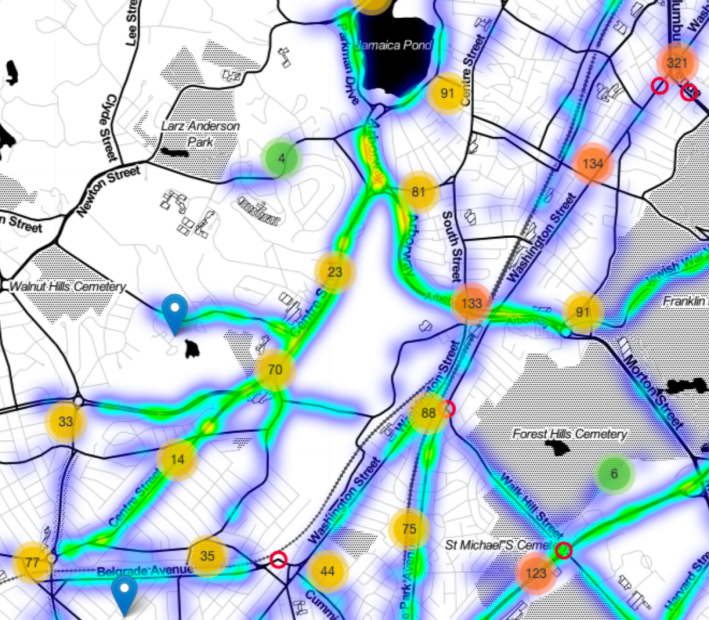
Here's the heat map of speeding incidents that the app recorded (orange and yellow areas indicate higher densities of speeding incidents, numerals indicate the number of crashes nearby, and red dots indicate the locations of fatal crashes):

The city's analysis notes that "there is a lot of speeding on major roadways, particularly along I-93, the Pike, and Storrow Drive," as well as the Longfellow Bridge, Soldiers Field Road, and the Riverway near Park Drive.
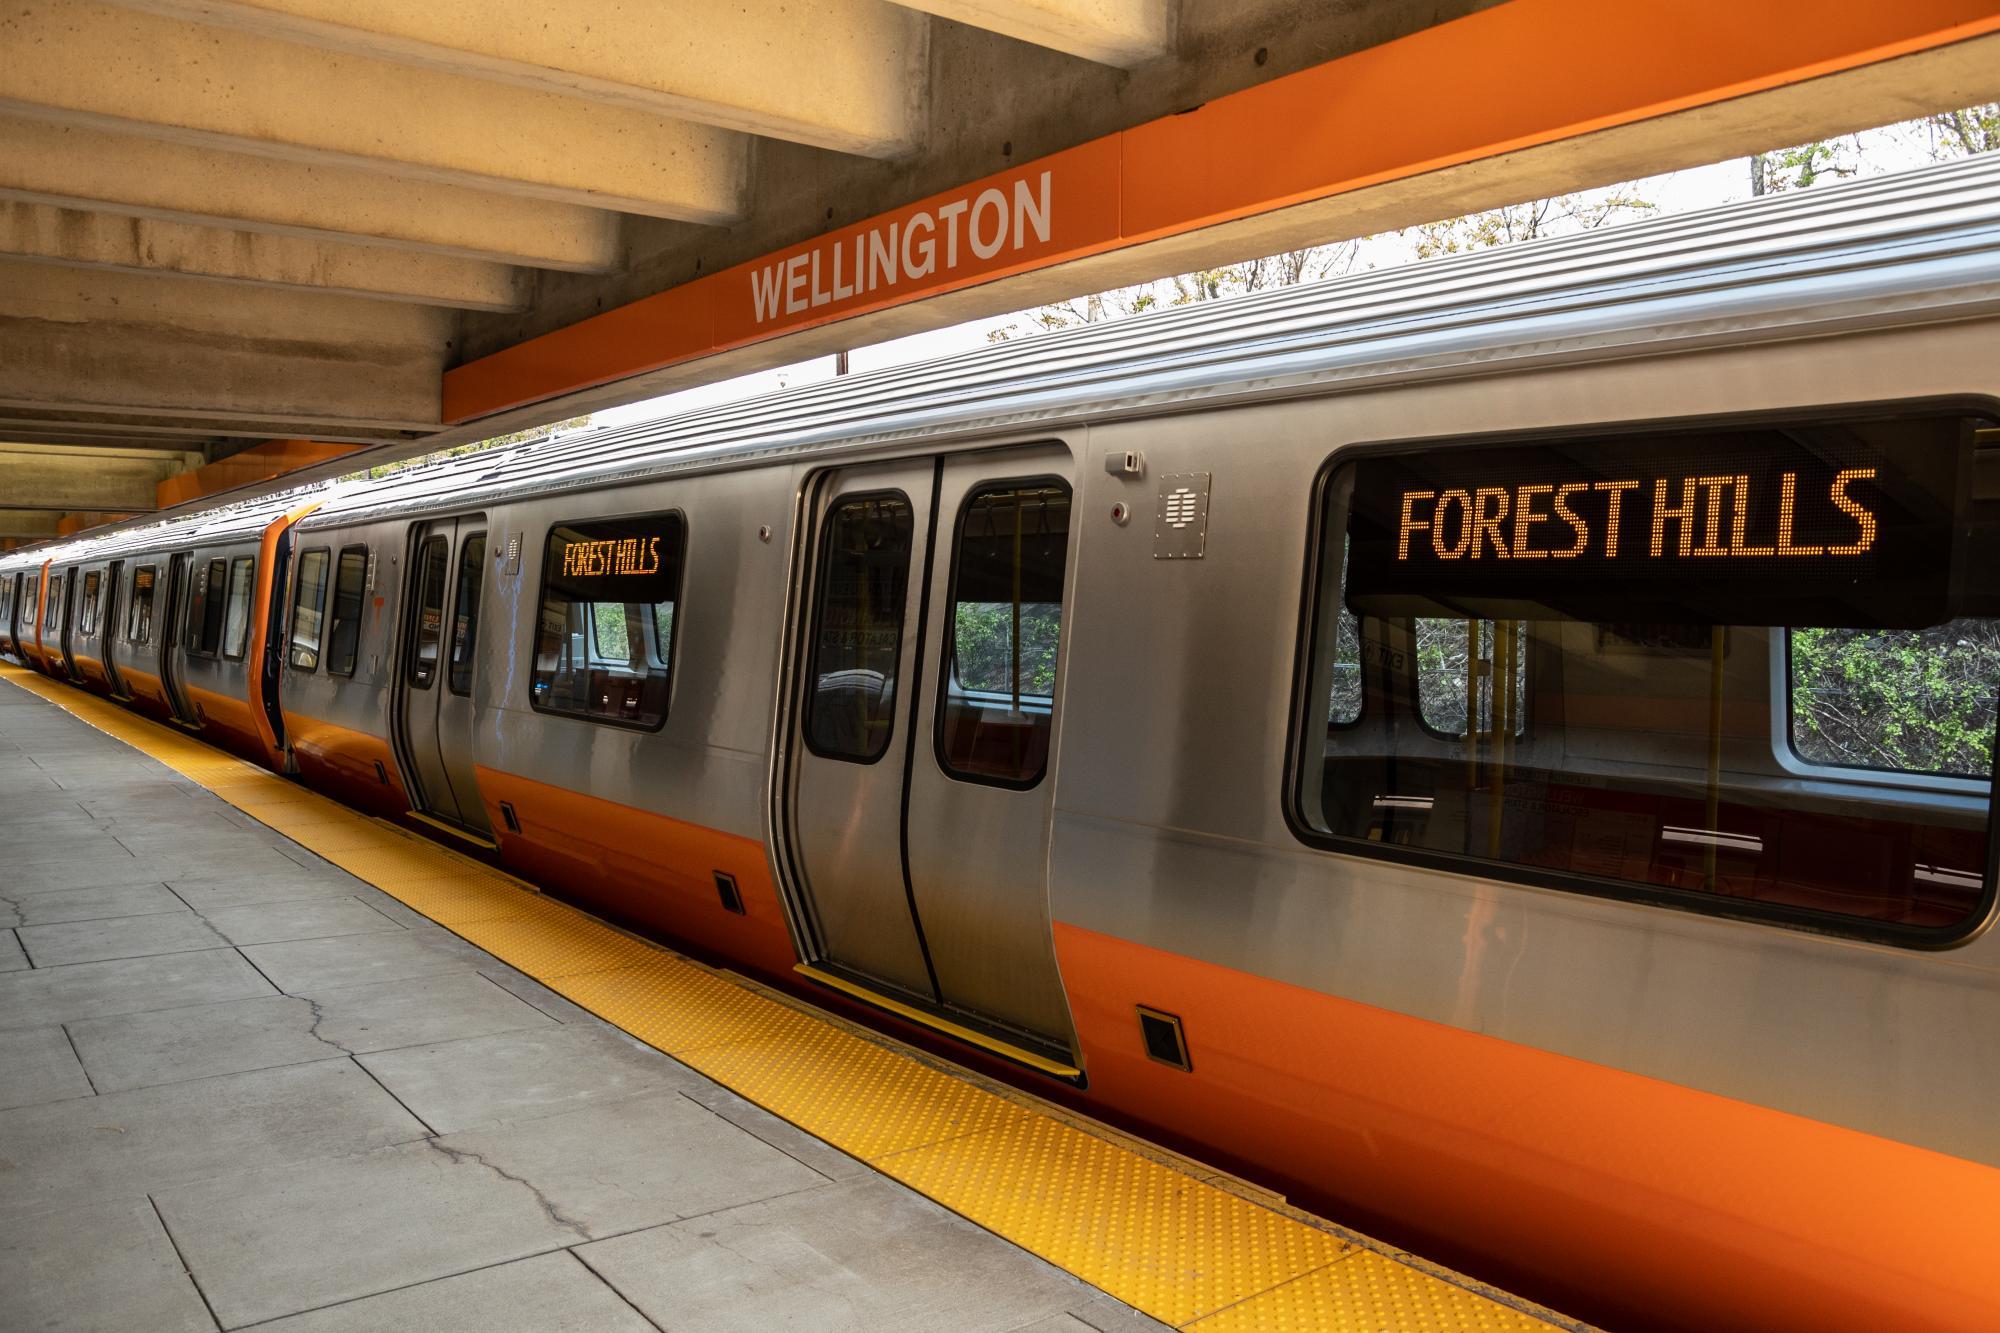
The DCR-controlled Arborway between Forest Hills and Jamaica Pond – currently the subject of a redesign study – is also highlighted as one of the city's worst corridors for speeding, as is Centre Street, which is controlled by the DCR between the VFW Parkway and the Arborway.
Most of these are state-controlled roadways, either under the jurisdiction of the MassDOT or the state Department of Conservation and Recreation (DCR), which limits how much the City of Boston can do to improve safety in those areas.
Kris Carter of the city's Office of New Urban Mechanics stressed that "we take the privacy of this data very seriously," and that the contest's privacy policy mandated that the analysis would be done by a third-party researchers on aggregated, anonymized data before it was deleted altogether. But the third-party analysis is public, and available on the city's website.
Read More:
Stay in touch
Sign up for our free newsletter