Data Confirm That More Fatal Crashes Happen in Commonwealth’s Black Neighborhoods
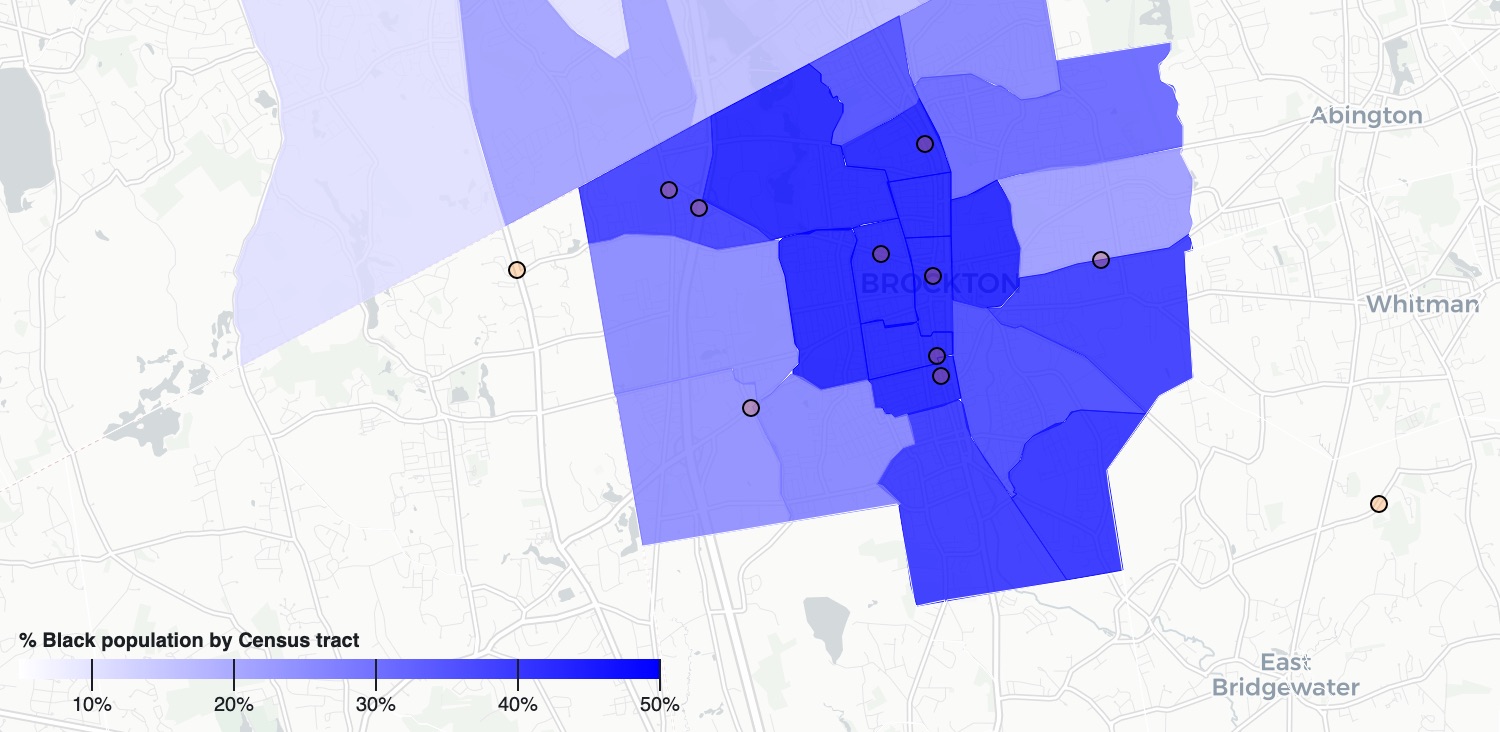
A plot of fatal crashes (red circles) that involved a bike rider or pedestrian between 2018 and 2020 in the greater Brockton area. Of 11 fatal crashes in the region, 9 occurred in neighborhoods where Black residents make up 10 percent or more of the total neighborhood population.
Of the 210 fatal car crashes in Massachusetts where a driver killed a bike rider or pedestrian between 2018 and 2020, a quarter of those killings occurred in neighborhoods where the Black population makes up a higher-than-average proportion of the neighborhood population, according to a Streetsblog analysis of MassDOT fatal crash records.
According to U.S. Census Bureau estimates, the population of Massachusetts as a whole includes 5.3 million people who identify as white alone (78 percent of the population) and 522,000 people who identify as Black or African-American (8 percent of the population).
But Black households tend to be segregated in fewer neighborhoods: more than two-thirds of the Commonwealth's Black residents live in Census tracts where 10 percent or more of the population identifies as Black. These neighborhoods include places like Roxbury and Dorchester in Boston, the McKnight neighborhood of Springfield, and in gateway cities like Brockton and Lynn.
According to location data from the MassDOT's crash database, 52 of the state's 210 fatal crashes involving a bike rider or pedestrian between 2018 and 2020 occurred in those neighborhoods.
By contrast, only 18 fatal crashes involving bikes or pedestrians occurred in whiter-than-average Census tracts, where at least 95 percent of residents identify as white.*
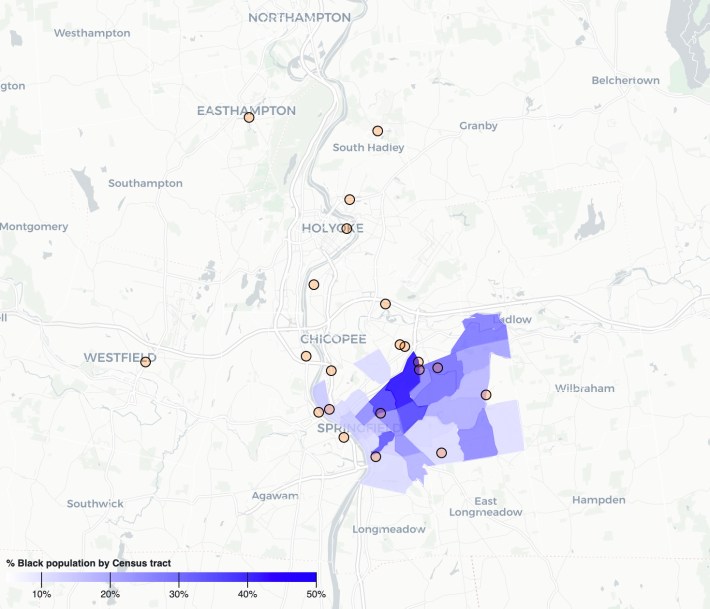
Maps of MassDOT's crash data overlaid on Census demographic information reveal the patterns in cities like Brockton (above) and in regions like the Pioneer Valley, where fatal crashes are highly concentrated in the Black neighborhoods of Springfield:
The victims of these crashes aren't merely dots on a map. They include people like Antonio Tavares, a 61 year-old Cape Verdean immigrant who died when a police officer struck him with his cruiser on Brockton's Main Street in August 2019.
Or Brenda Lee Keller, 57, who was known for sharing food from her own refrigerator with neighbors in need until a hit-and-run driver killed her near her home in Mattapan in May 2019.
In her new book "Right of Way: Race, Class, and the Silent Epidemic of Pedestrian Deaths in America," former StreetsblogUSA editor Angie Schmitt writes about how safety on public streets (or lack thereof) is intricately tied up with legacies of systemic racism, segregation, and traffic engineers' implicit biases.
A quotation in the book from transportation consultant Tamika Butler deftly describes these maps of fatal crashes in Massachusetts: "When you take data of race and socio-economic status and overlay it with where there are the most traffic incidents, and the most traffic deaths and serious injuries, communities of color and low-income communities light up those maps," says Butler.
*Differences in total population could account for part, but not all, of this discrepancy: 14 percent of the state's population lives in those whiter neighborhoods where at least 95 percent of the population identifies as white, while 19 percent of the state's population lives in neighborhoods where at least 10 percent of residents are Black.
Read More:
Stay in touch
Sign up for our free newsletter