According to year-end statistics compiled by the Boston Planning and Development Agency (BPDA), City of Boston planners approved 59 new development projects in 2019 that could build 4,762 new homes and 2.9 million square feet of commercial space – and along with those projects, developers would build enough parking to house 5,080 more cars.
Most of that new parking will be built in transit-rich neighborhoods located within half a mile of an MBTA rapid transit, Silver Line, or commuter rail stop, and more than 90 percent will be attached to residential and mixed-use projects.
According to end-of-the-year summary data provided by the BPDA, Boston's planning agency approved 27 purely residential projects last year that would build 1,984 new housing units and 2,152 parking spaces – an average of 1.1 new parking spaces for each new home.
The BPDA also approved 19 mixed-use projects, among which residential uses were the primary component overall. Those projects include 2,778 new homes, 505,722 square feet of commercial space, 774,842 square feet of "other" uses (such as community spaces or plazas), and 2,621 parking spaces.
2019 BPDA project approvals for mixed-use and residential developments
"TOD" indicates projects located in transit-oriented districts. Source: BPDA
| Purely Residential Projects | |||
|---|---|---|---|
| Total | in TOD | % TOD | |
| Projects | 27 | 22 | 81% |
| Housing Units | 1,984 | 1,370 | 69% |
| Residential SF | 2,128,289 | 1,428,122 | 67% |
| Other SF | 740,294 | 647,851 | 88% |
| Parking Spaces | 2,152 | 1,522 | 71% |
| Mixed Use Projects | |||
| Total | in TOD | % TOD | |
| Projects | 19 | 18 | 95% |
| Housing Units | 2,778 | 2,742 | 99% |
| Residential SF | 2,576,413 | 2,543,128 | 98.70% |
| Commercial SF | 505,722 | 501,627 | 99.20% |
| Other SF | 774,842 | 768,962 | 99.20% |
| Parking Spaces | 2,621 | 2,587 | 99% |
The expectation that most residents of these new homes will bring cars with them does not align with actual City of Boston household demographics. According to Census estimates, one in five Boston households do not own a motor vehicle, and among renters, 30 percent of households are car-free.
In its 2019 "Perfect Fit" report, which surveyed parking use at new residential developments in Boston and its suburbs, the Metropolitan Area Planning Commission found that "the garages and lots we visited were rarely full, and many had ample empty parking... average parking use was less than one space per household, and across the entire sample (which included many sites out side of Boston, with less transit access), only 70 percent of the available spaces were full when surveyed. In affordable housing developments... demand was even lower: only 0.55 cars were parked per household.
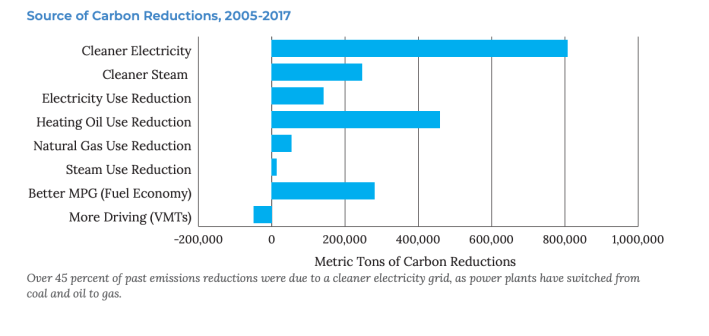
The binge in new parking garage construction is likely to undermine Mayor Walsh's climate goals, which call for reducing car use in the City of Boston by half within the next decade, and undermine his administration's drive for more affordable housing.
Related:
StreetsblogUSA: Apartments With Free Parking Reduce Transit Ridership
"Providing abundant parking encourages more vehicles on the site, increasing the number of trips and traffic on nearby roads," wrote the authors of the "Perfect Fit" report. "In neighborhoods that are accessible to an MBTA station, this means fewer people use the available transit, while congestion, pollution, and greenhouse gas emissions rise."
The surplus of parking will also drive up the cost of these projects for their developers, and ultimately, for the renters and homeowners who move into these homes. According to industry estimates, the median construction cost for above-ground parking garages in greater Boston is about $24,486 per space.
BPDA-approved commercial and institutional developments were more likely to shun parking construction. In 2019, the BPDA approved 2.4 million square feet of new commercial space among 9 projects, all located within half a mile of an MBTA stop. Those projects included only 237 new parking spaces.
2019 BPDA project approvals for commercial and institutional developments
"TOD" indicates projects located in transit-oriented districts. Source: BPDA
| Purely Commercial Projects | |||
|---|---|---|---|
| Total | in TOD | % TOD | |
| Projects | 9 | 9 | 100% |
| Commercial SF | 2,358,671 | 2,358,671 | 100% |
| Other SF | 261,791 | 261,791 | 100% |
| Parking Spaces | 237 | 237 | 100% |
| Purely Institutional Projects | |||
| Total | in TOD | % TOD | |
| Projects | 4 | 3 | 75% |
| Institutional SF | 672,140 | 651,140 | 97% |
| Other SF | 35,000 | 35,000 | 100% |
| Parking Spaces | 70 | 0 | 0% |
Cutting Boston's car use in half by 2030 is a key goal of the city's climate action plan, but to date, there's been no evidence that the city has any progress toward that benchmark; instead of declining, recent data show that the total number of miles traveled by motor vehicles in Boston has continued to increase.
Although the overall picture is bleak, the BPDA did approve a handful of projects that will include no on-site parking. Among them were 141 Westland Street, a modest 4-story building that would add 14 compact apartments within walking distance of the Fields Corner Red Line stop. Thanks in part to the lack of parking expenses associated with the project, its developers hope to rent its units for $650 to $850 a month.
Another project that was approved with no on-site parking, 2-10 Maverick Square, would replace a surface parking lot located across the street from the Maverick Blue Line station with 25 new apartments over two new neighborhood retail spaces.
