The Bay State’s Special Education Transportation System Is Draining School Budgets
Massachusetts’ special education transportation system is facing unsustainable costs because districts are working within a rigid reimbursement model and contending with a market with weak vendor competition, according to a new report from the commonwealth’s Inspector General.
While neither general education nor special education populations have significantly increased in recent years, Massachusetts school districts have still seen a sharp increase in transportation costs due to inefficient contracting, routing, and state rules that make service more expensive.
Last month, the Office of the Inspector General (OIG) released a study, Special Education Transportation Study: Strategies to Mitigate Rising Costs, a 92-page report that evaluates the state’s special education transportation structure, that explains why these costs are rising and recommends changes that state agencies and local school districts can make to rein in their spending.
Cost increase factors
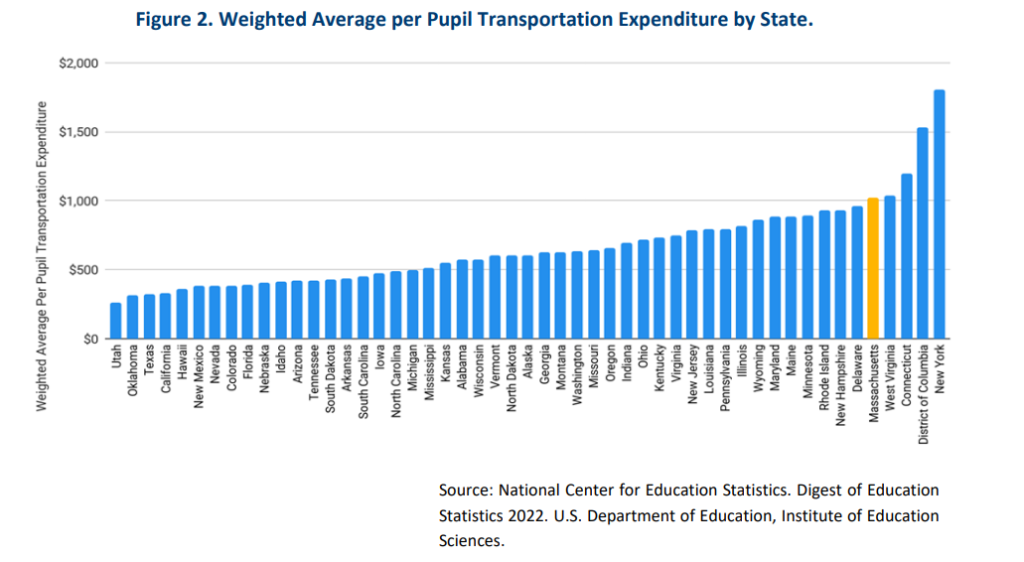
Inflation, driver shortages, vehicle costs, and increasing special education placements have all pushed Massachusetts to the higher end of national student transportation spending.
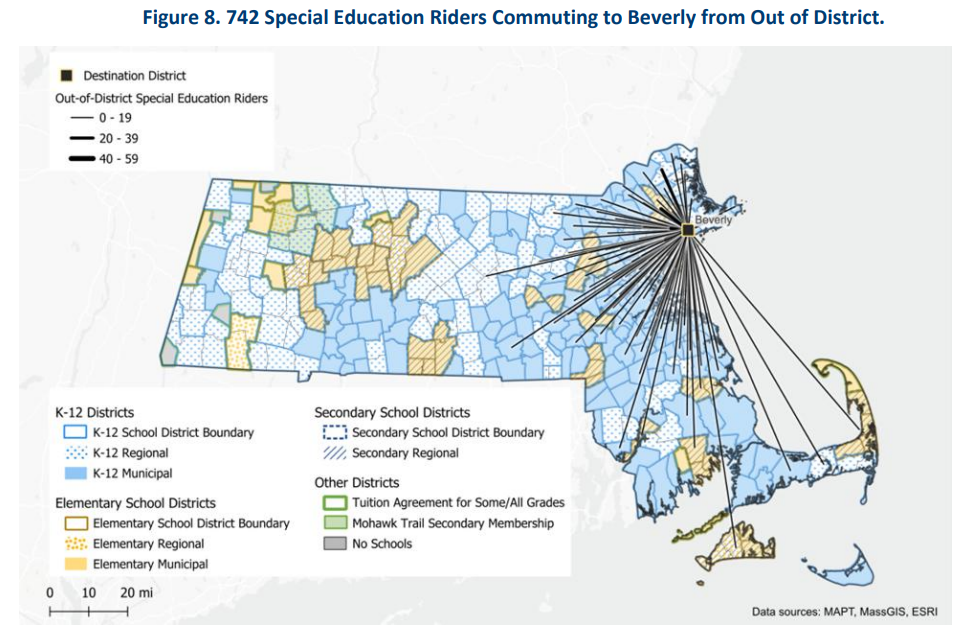
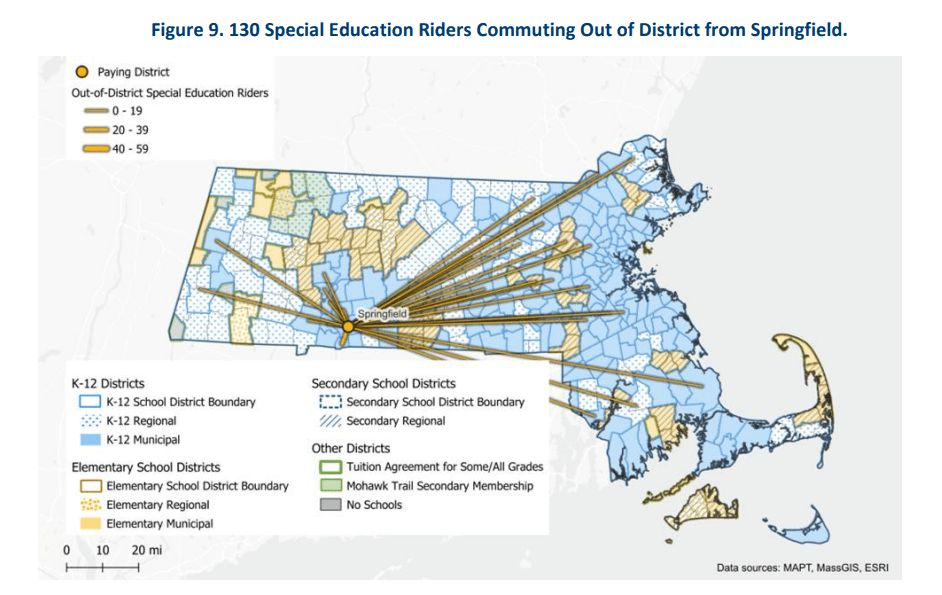
Massachusetts regularly places more students in out-of-district special education programs compared to the rest of the country. In 2023, 6.1 percent of students with disabilities go to schools outside of their home district, compared to the nationwide average of 2.3 percent.
The median district sends students across 11 different municipalities, which complicates transportation planning for individual students.
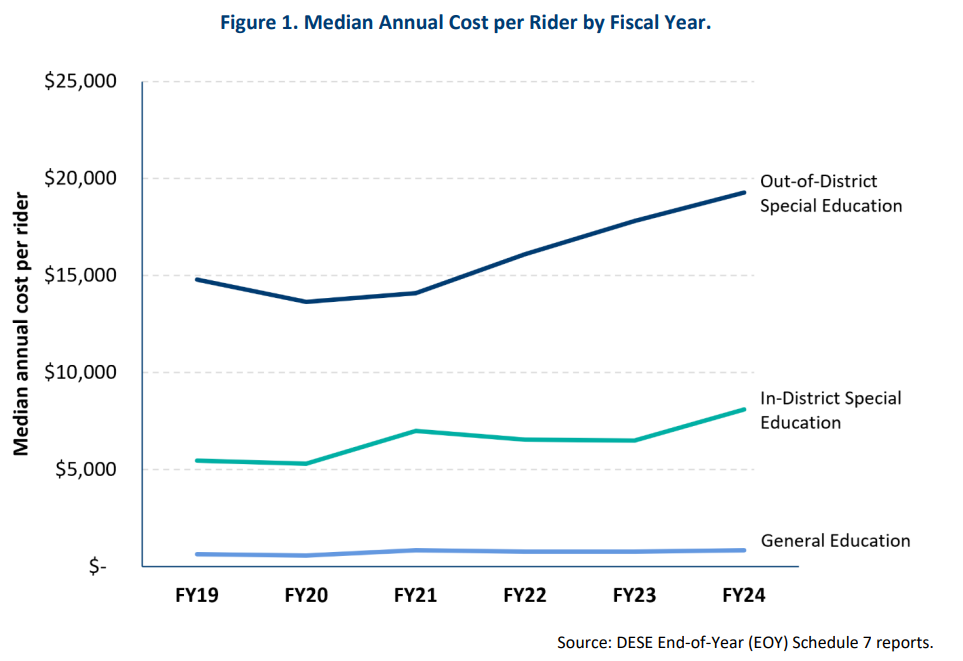
In FY24, Massachusetts school districts bused 61,996 students to special education programs, with an average cost of $13,825 per student.
Education transportation funding
School districts are able to get transportation-based reimbursement for transporting a number of different types of students to school, from homeless students, to students in vocational programs where the districts pay tuition, and foster care students.
Under the Commonwealth’s Special Education Reimbursement Program, more commonly known as the “Circuit Breaker Program”, the state reimburses part of a school’s special education costs in two main buckets of tuition/instruction and transportation.
The Circuit Breaker Program allows for school districts to be reimbursed for 75 percent of any costs that exceed the state-determined per-pupil threshold amount, but transportation reimbursement is delayed into the next year, and tuition/instruction costs get prioritized if state appropriations won’t meet full reimbursable amounts. Because of this, state reimbursement rates for transportation have fallen from the full 75 percent in FY24 to 61.36 percent in FY25.
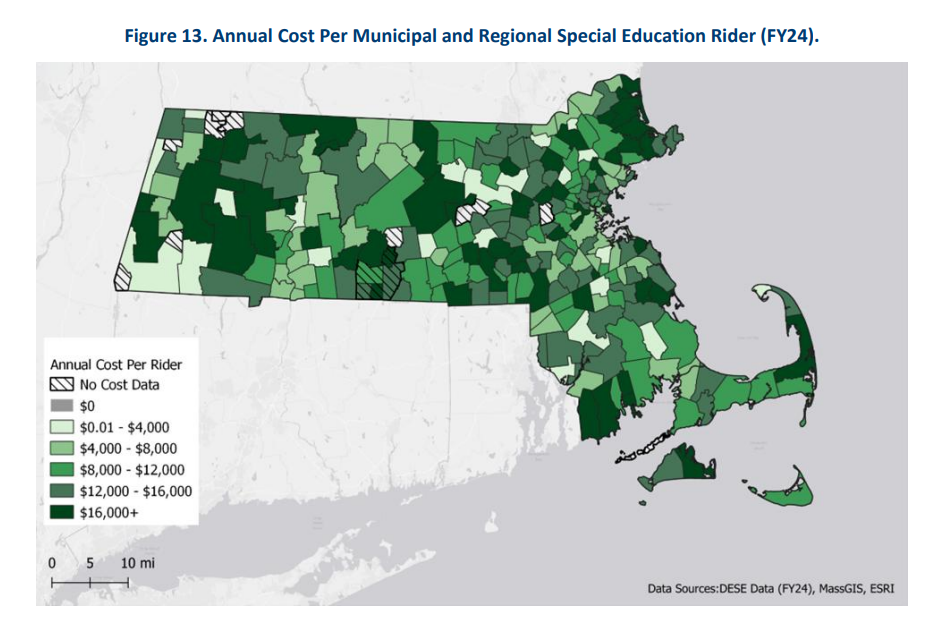
“The top 25 percent of districts in Massachusetts spent at least 70 percent of their special education transportation expenses just on out-of-district transportation.”
In this funding structure, schools are not reimbursed for costs within the same fiscal year, but rather have to present end-of-year student reports to the state and await reimbursement in the following year.
To address this clunky funding structure, the OIG collaborated with a school transportation consulting firm to conduct stakeholder interviews, survey school districts, and review administrative data, documents, and legislation.
There have been at least four separate studies on this topic in the last 20 years, but limited follow-through remains the issue.
Why costs are rising
Special education transportation is either provided by the district itself or through a vendor, and requires a number of supports.
Student need is the primary factor in determining education placement, and combined with resources like specialized vehicles, specific equipment, door-to-door service, and staffing, this can drive costs up dramatically – to the point where the cost of tuition and transportation for a few special education students traveling out-of-district can cost more than staffing and operating a program in-district.
The factors at the core of the cost issue include distant out-of-district placements, a “persistent” shortage of qualified drivers, and lack of vendor competition.
Other issues lie at the administrative level, with complex procurement requirements, challenges in districts sharing information with one another, vehicle requirements, and the state’s unique reimbursement funding model.
What districts can control
School districts are facing some conflicting truths. The market for bus drivers has seen a decrease in supply, yet an increase in demand. School districts face a lack of competition among school transportation vendors, but also struggle to share information with each other, creating competitive disadvantages.
The complex procurement process, with new requirements often layered onto old specifications, the misaligned timing of when procurements are issued against a market where resources are already being allocated, and the difficulty of managing contracts against evolving student needs (especially in smaller districts) negatively impacts vendor pricing and the number of bids districts receive.
What the state controls
The state has also played a role in making it difficult for school districts to reduce transportation costs.
The state has a one-hour limit for travel that does not always align with individual students’ needs to attend specific programs, and the state’s strict and specific requirements for vehicles can also limit options.
The state’s delayed cost reimbursement structure also creates financial challenges for districts.
Together, those state-specific aspects of the special education transportation process result in a funding strain on districts, a lack of cost controls in same-year funding, creates uncertainty, and potential inequity for school districts trying to manage their transportation costs.
Regionalization can help, but how much?
Given how scattered student trips and program locations are, the idea of regionalization has come up as a solution to address the state’s education transportation funding system – but the OIG report warns it is not a “panacea” that will meet the needs of every district.
Some regionalization and similar collaborative structures already exist. The Southeast Transportation Network led by the North River Collaborative serving districts in the South Shore Collaborative and Pilgrim Area Collaborative saved participating districts an estimated $54,000 in its first year, while the LABBB Collaborative, which started out serving students in Arlington, Burlington, and Lexington schools saved participating districts more than $92,000 in two years.
However, regionalization is not as easy as it seems.
Student transportation patterns do not line up neatly with regional boundaries.
While the concept of regionalized districts can save money, they can also have higher median transportation costs as they bring in costly outliers of student transportation such as the Boston area and Western Massachusetts that may be obscured by median cost data that can make regionalization and coordination across districts difficult.
Pilot programs have been successful in promoting collaborative special education transportation, but they’ve also struggled without the necessary financial support from the state. Some programs lost steam without ongoing interest or participation from local districts.
Recommendations
The OIG presented three major recommendations: for school districts to maximize their purchasing power, for the Massachusetts Legislature and the Department of Elementary and Secondary Education (DESE) to consider consolidating transportation services regionally, and for DESE and the Massachusetts Legislature to promote flexibility, transparency, and accountability in school transportation.
What districts should do
For school districts to maximize their purchasing power, the report recommends school districts issue their transportation procurements earlier, maximize the potential for competitive bids, assess vendor contract requirements and expectations to avoid driving up costs.
Districts should also collaborate to identify best practices in procurement or go in joint procurements, and leverage the unique feature of special education transportation being exempt from Chapter 30B requirements to procure the best services and prices they can.
What the Legislature should change
The report also calls on DESE and the Legislature to do their part in encouraging accountability, transparency, and flexibility in school transportation.
In order to do this, the Inspector General recommends that lawmakers amend the timing of Circuit Breaker reimbursements, revise laws to require more vendor cost transparency, and allow more flexibility for the types of vehicles that can be used for student transportation.
What DESE should offer
To make this work easier on districts, the report also recommends DESE create a centralized repository for bid documents and contracts, standardize procurement documents and contracts, explore establishing a pricing rate structure, and expand the technical assistance that the state provides.
To revisit the idea of consolidated, regionalized programs, the OIG report recommends that the state legislature support regional procurement and shared services, and that the state Department of Elementary and Secondary Education (DESE) encourage regional collaboration in program design.
Without these changes to reimbursement, procurement, and state processes, districts will likely keep paying more for special education transportation despite enrollment remaining relatively stable.
However, should stakeholders like the legislature, school districts, and DESE reassess their individual roles in this system, see and create opportunities for collaboration and regionalization, and adapt the processes and regulations that have long defined special education transportation, the state could see more competitive pricing, cost savings, new innovative programs, and more efficient government systems in the long run.

Streetsblog has migrated to a new comment system. New commenters can register directly in the comments section of any article. Returning commenters: your previous comments and display name have been preserved, but you'll need to reclaim your account by clicking "Forgot your password?" on the sign-in form, entering your email, and following the verification link to set a new password — this is required because passwords could not be carried over during the migration. For questions, contact tips@streetsblog.org.