Unpublicized City Hall Polling Reveals Broad Support for Bike Projects, Blue Hill Ave. Bus Rapid Transit
StreetsblogMASS has obtained internal City of Boston polling documents that show a strong majority of city residents support the proposed Blue Hill Avenue bus transitway project, and that a plurality of residents support bike lane projects, even when it comes at the expense of car lanes and on-street parking.
The city collected opinions from roughly 1,600 city residents who participated in a digital survey conducted in the first quarter of 2025, as Mayor Wu was beginning to gear up her re-election campaign and as her administration was launching its secretive “30-day review” of bike lane and bus lane projects.
The survey targeted respondents to get a represenative sample of Boston’s population in terms of age groups, gender, race and ethnicity, and neighborhoods of residence.
StreetsblogMASS first learned of the poll from an internal City Hall slide deck that summarized the results for city staff.
We confirmed its authenticity by reaching out to Daniel Steele, a former City of Boston research adviser whose name appears on the slide deck, and who helped administer the survey in partnership with zencity.io, a polling firm.
Steele no longer works for the city, but he discussed the results with us and provided some technical background information for this story.
More bike project supporters than opponents
City Hall’s polling indicated that bike lane projects were not particularly controversial, nor divisive.
“For polarizing issues, you’d expect to see a lot more people in the ‘strongly oppose’ and ‘strongly support’ columns,” said Steele. “This is not a polarizing issue for most people.”

The polling also debunks tropes that bike lanes are more controversial among certain racial and ethnic groups.
In reality, the polling found no significant differences in opinion by skin color, although white people are slightly more likely to be “strongly opposed” to bike lane projects:
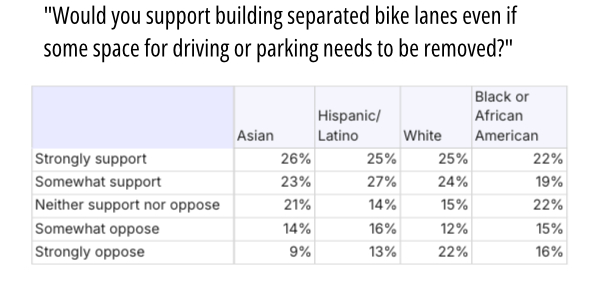
Similarly, there were no significant differences of opinion among varying household income groups and education levels.
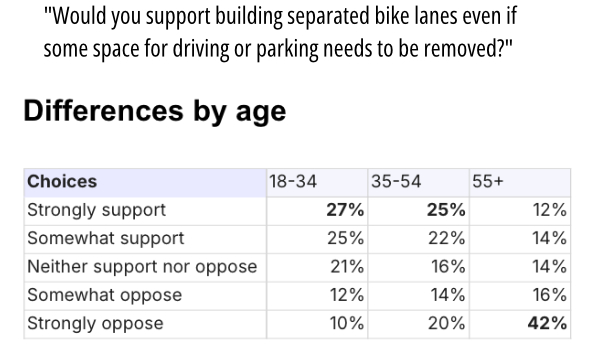
There was, however, one demographic that is more likely to despise bike lanes, regardless of their race or class: residents aged 55 and older.
While a majority of respondents under 35 said that they support bike lanes, 42 percent of residents older than 55 say they “strongly oppose” them:
Blue Hill Avenue bus rapid transit has broad citywide support, though polarizing in Mattapan
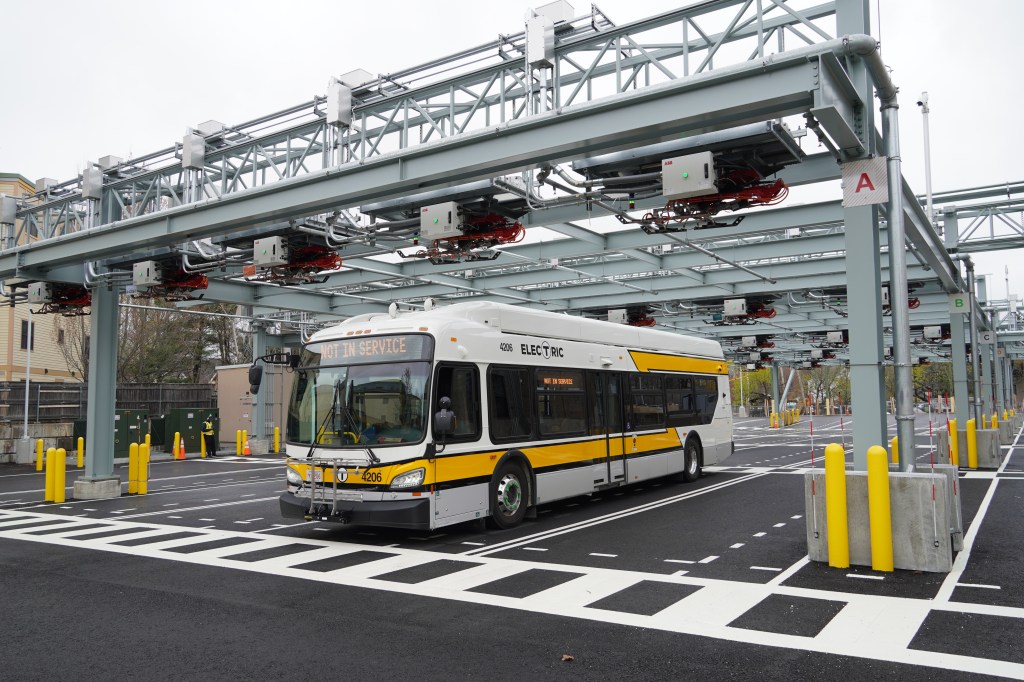
A second question from the winter 2025 polling asked residents about the Blue Hill Avenue busway project between Mattapan and Grove Hall.
The full survey question included a lengthly introduction to give respondents some background information.
“Boston’s Blue Hill Ave. is getting a major redesign to add center-running bus lanes and bike lanes,” pollsters explained. “While some traffic lanes may be removed, it will nearly double the current capacity for moving people to about 15,000 users per hour. The project will add 150 trees and about 20 basketball courts of greenery to the roadway, while maintaining 90 percent of existing parking. Do you support this project?”
Citywide, 60 percent of respondents answered that they either “somewhat” or “strongly” supported the project, compared to only 15 percent of respondents who expressed some degree of opposition.
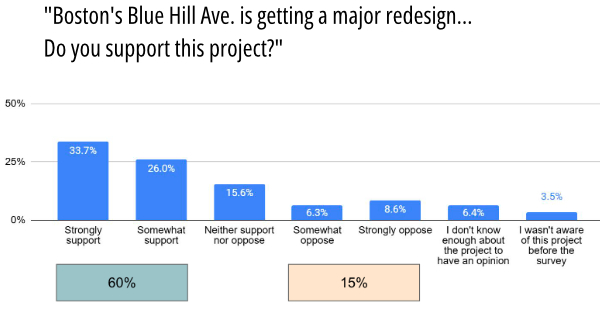
A quarter of respondents either expressed no opinion or said that they didn’t know enough about the project to form one.
As with the bike lanes question, there were no significant differences of opinions between racial groups or income levels.
There was slightly more opposition among the group of respondents aged 55 or older, but even in that age group, far more respondents said that they would support the Blue Hill Avenue busway project compared to the number who expressed opposition.
One noteworthy distinction from these citywide results was the breakdown of support by neighborhood.
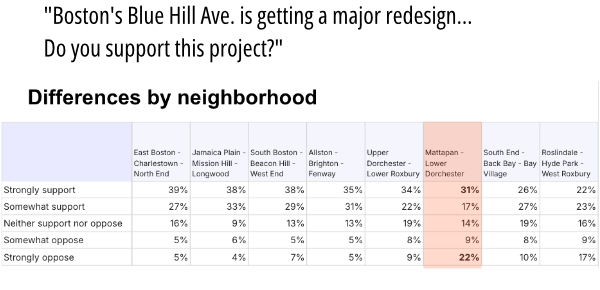
While the project has considerably more supporters than opponents in every neighborhood across the city, respondents from neighborhoods near Blue Hill Avenue had considerably higher levels of “strong opposition” to the project.
Steele noted that the project is, in fact, polarizing in the neighborhoods where it would be built. But even there, supporters outnumber opponents 48 percent to 31 percent.
Punditry vs. the public
The city’s poll results seem to differ considerably from another public opinion poll that the Boston Globe and Suffolk University conducted last summer.
In that survey, pollsters asked 500 likely preliminary election voters “what impact have bike lanes had on your ability to get around the city?”
50 percent of respondents answered that bike lanes had made it “slower and less convenient to get around,” versus 18 percent who answered that bike lanes made it “easier and safer” to travel.
Rich Parr, a pollster for the MassINC polling group, noted that the the two questions are fundamentally different, and their results are not necessarily inconsistent.
“You might think that bike lanes are kind of a pain in the butt and make it harder to get around, but you could still believe they’re worth building for the sake of safety,” Parr observed.
Another key difference in the two polls involved who actually took the surveys.
The city’s poll surveyed 1,500 people from across the city, representing a broad swath of the city’s demographics.
The Globe/Suffolk poll surveyed 500 likely voters for the city’s preliminary elections – a contest that historically gets low voter turnout.
“The pool of city residents (in the city’s poll) is going to be younger, and more diverse, whereas registered voters are going to be whiter, more settled as homeowners, less likely to be students,” said Parr. “And then finally the ‘likely’ votes for a mayoral election are the most rarified group, older, much more settled in their communities, more likely to be homeowners.”
There’s a third important difference between the two polls.
The Globe/Suffolk poll was sponsored by the region’s biggest newspaper, and covered widely in the local media. The city’s polling results never left City Hall – until now.
In a July article about the poll’s results, Globe political reporter Emma Platoff labelled bike lanes a “vulnerable point” in Wu’s campaign.
Television pundit Jon Keller cited the Suffolk poll to allege that “voters were still fuming” over the Wu administration’s street safety projects, and theorized that challenger Josh Kraft would have been more successful if only he had spent even more time griping about bike lanes.
As it turns out, Mayor Wu’s administration had information that debunked those assertions.
Steele’s slide deck included a screenshot of an anonymous reader comment in the Boston Globe which alleged “the 1 percent of bike lane proponents are going to be furious at the 99 percent of people who hate bike lanes.”
“If we only read the Globe, we would have a very skewed picture,” wrote Steele.
Learn more: view the City of Boston’s community survey slide deck here.

Read More:
Streetsblog has migrated to a new comment system. New commenters can register directly in the comments section of any article. Returning commenters: your previous comments and display name have been preserved, but you'll need to reclaim your account by clicking "Forgot your password?" on the sign-in form, entering your email, and following the verification link to set a new password — this is required because passwords could not be carried over during the migration. For questions, contact tips@streetsblog.org.