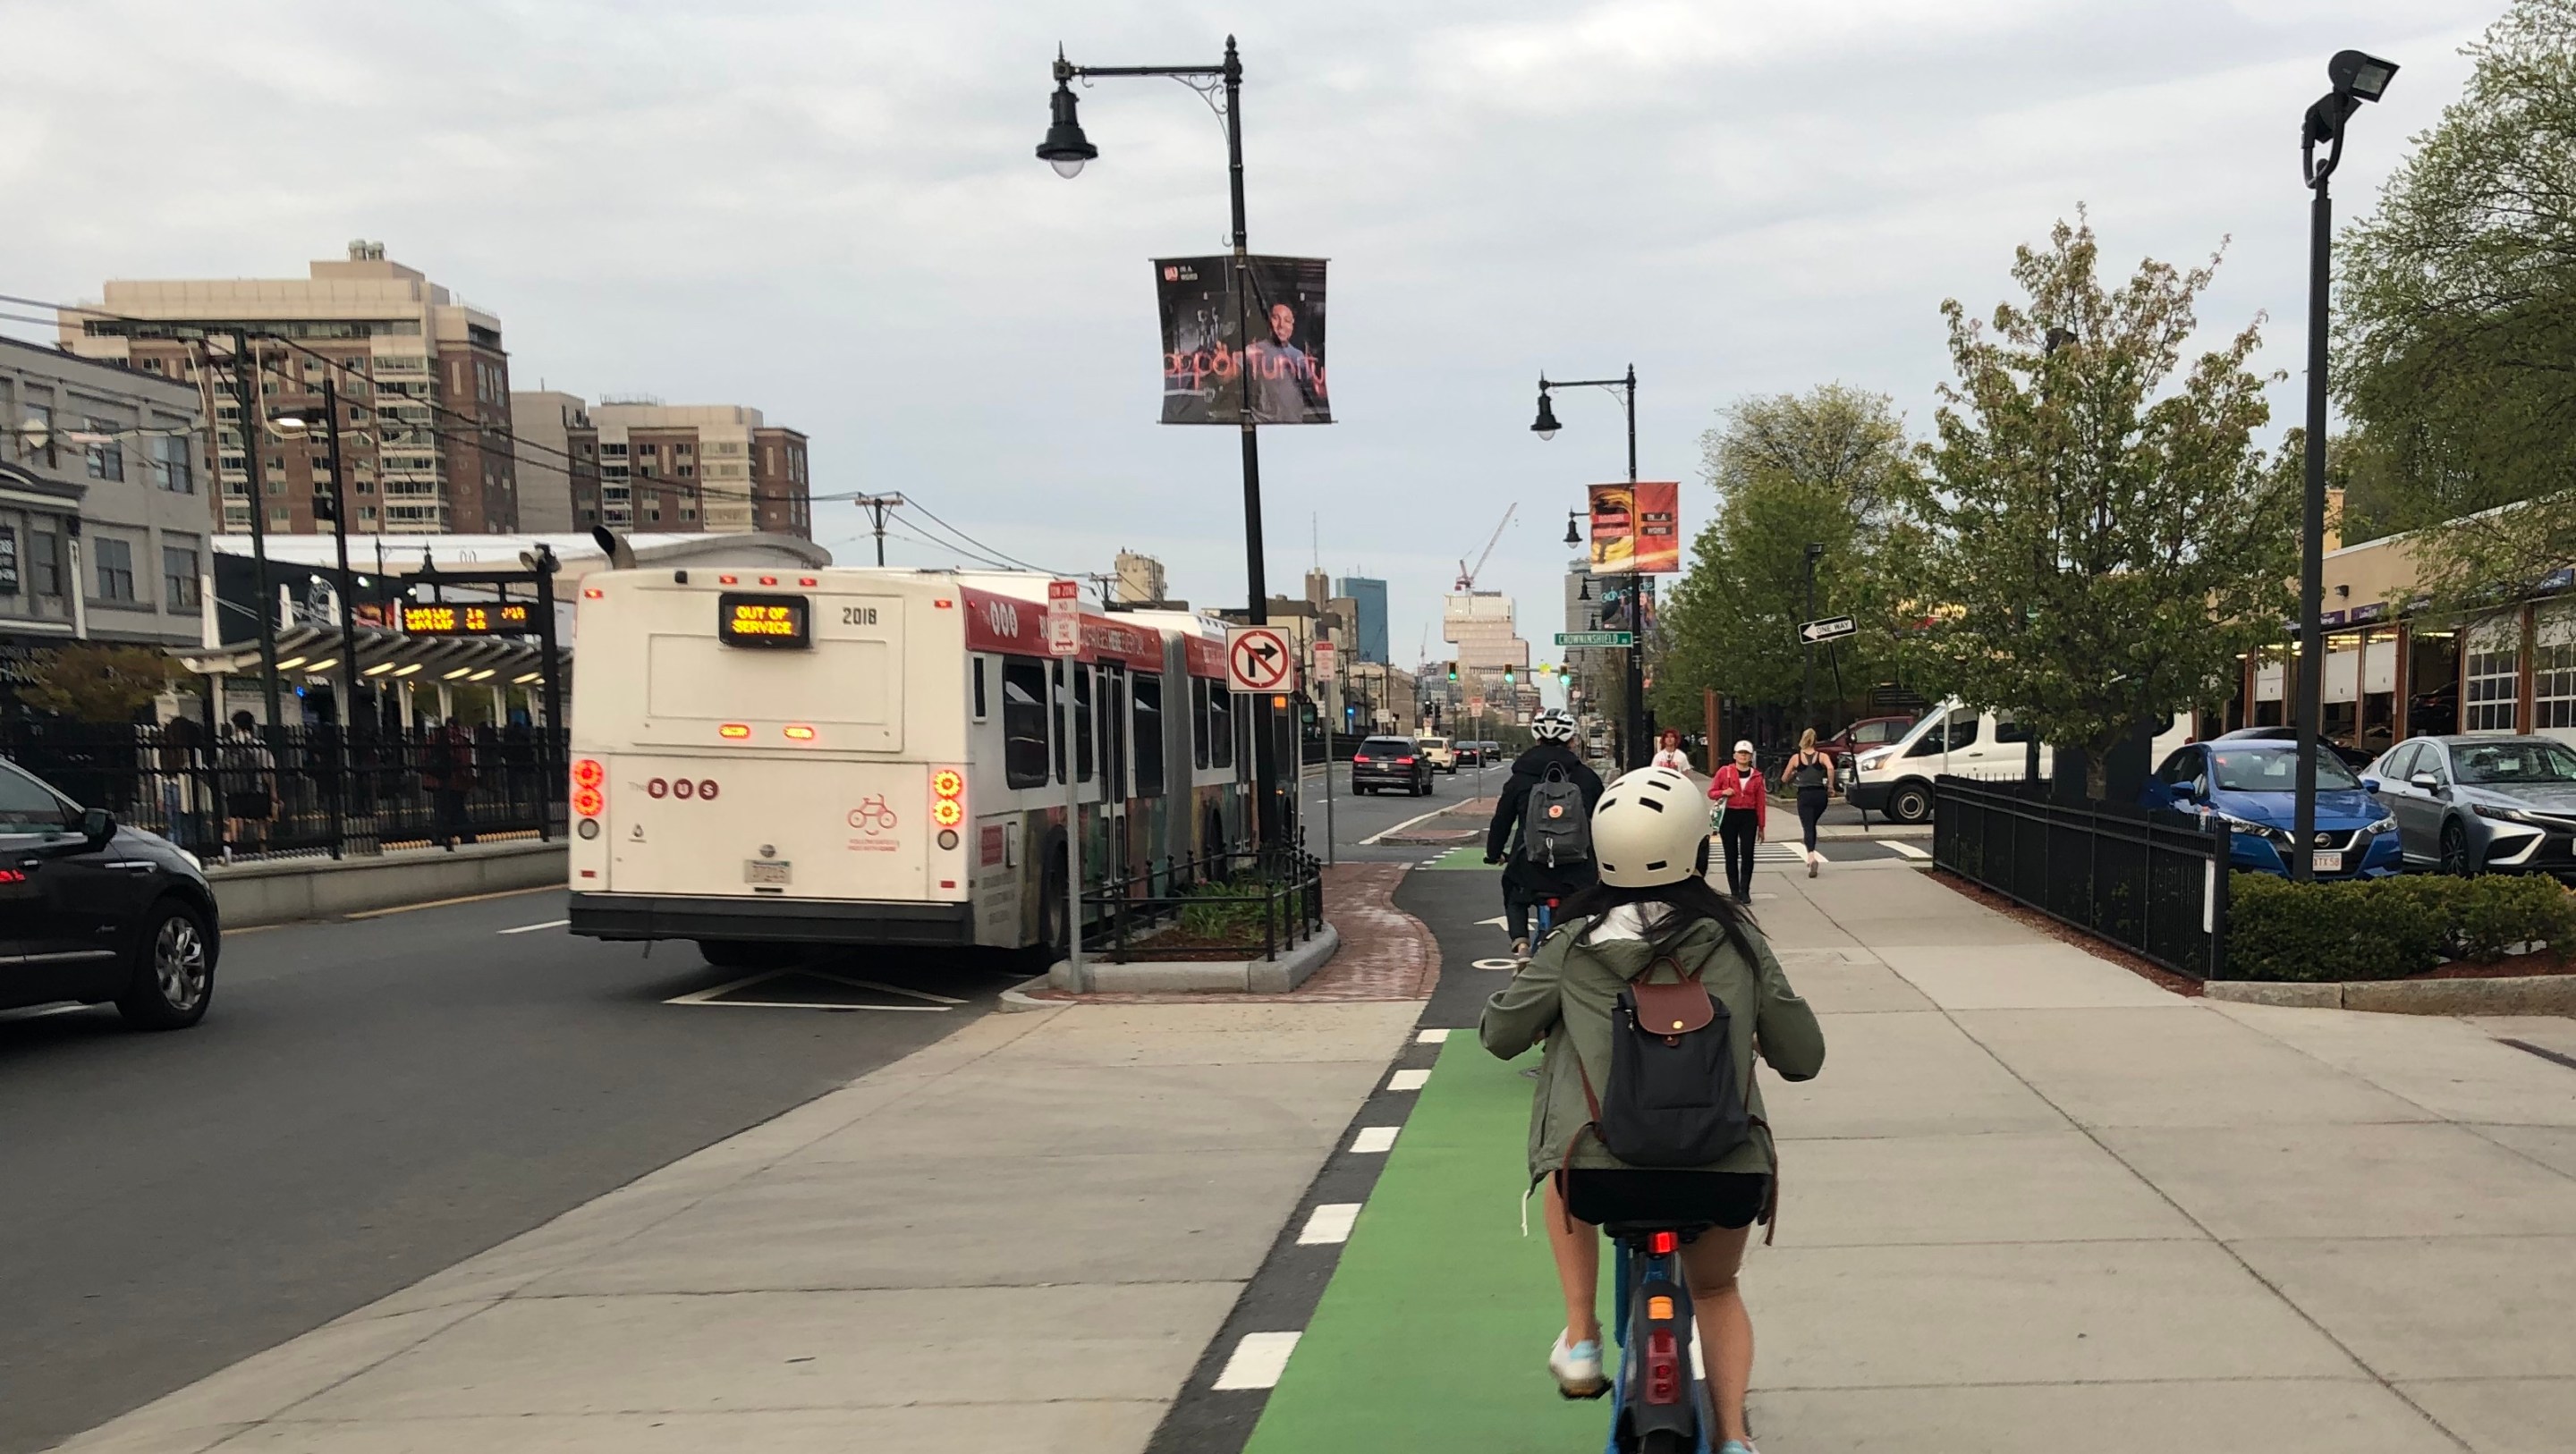
A new statistical analysis of ridership data from the Bluebikes system suggests that the new Commonwealth Avenue protected bike lanes, which were finished in 2019, increased bike traffic by at least 80 percent relative to the paint-only bike lane that existed before the construction project began.
In a new paper published this month in the Case Studies on Transport Policy journal, Elizabeth Karpinski, a senior data scientist for the MITRE Corporation, describes three statistical models she used to see whether a surge in Bluebikes ridership in the Allston, North Brookline, and Fenway neighborhoods could be attributed to the new bike lane or to other, more general factors.
"I was studying changes in travel patterns in the bikeshare system, and I noticed that Commonwealth Avenue had very predictable ridership until, right around 2018, I saw a spike in activity among the stations around that route. The traffic just exploded. It was such a strong effect that I got curious, and that’s when I saw they had put in a separated bike lane," said Karpinski in a phone conversation with Streetsblog on Wednesday.
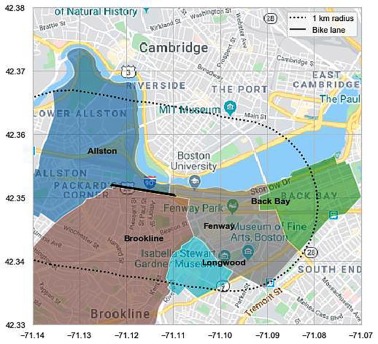
To test her theory, Karpinski downloaded public trip data from the Bluebikes system to analyze 612,936 one-way trips that began and ended within 1.5 kilometers of the new bike lane (see map).
She then used an open-source routefinding service to divide those trips into a "control group" - neighborhood trips that wouldn't typically use Commonwealth Avenue between Packard's Corner and the B.U. Bridge (a ride from Coolidge Corner to the Fenway, for instance) - and a "treatment group" - trips that likely would have (such as a trip from Harvard Avenue in Allston to Kenmore Square).
Before construction began, in 2016, there were 3,320 monthly trips, on average, in the treatment group of trips whose routes involved Commonwealth Avenue, and 5,273 monthly trips in the control group involving all other bike routes in the adjacent neighborhoods of Allston, North Brookline, and Fenway.
By 2019, when construction on the new bike lanes finished, bike traffic across the entire neighborhood had more than doubled. But the number of trips involving routes in the treatment group, using the newly-built protected bike lanes, had more than tripled, to 10,318 monthly trips.
However, Karpinski warns that it's probably not fair to give the new bike lane all of the credit for that increased ridership: bike traffic across the entire city had also been increasing, and the Bluebikes system in particular also underwent a major expansion in 2018 and 2019, with several new docks installed along Commonwealth Avenue in Allston, Brighton, and Fenway.
Instead, she writes, the tripling of bike traffic is "best interpreted as a possible upper-bound of the effect associated with the installation of the bike lane."
Using a more sophisticated model with more variables that could control for seasonal and citywide effects on bike ridership, Karpinski found that the new bike lane still had a statistically significant effect on Bluebikes use, and that the project increased bikeshare ridership by 80 percent on affected routes.
Karpinski described the second model as "a more conservative approach" whose estimate could be seen as a lower-end estimate of the project's true effect.
She also acknowledges that bikeshare ridership "may or may not represent a fixed or significant portion of all cycling" traffic - indeed, because bikeshare users may be less experienced and risk-averse than riders who own their own bikes, protected bike infrastructure may have a bigger effect on bikeshare traffic than for more regular riders.
But even if that's true, most transportation planners are far more interested in getting non-cyclists to give up their cars and try riding a bike for short trips than in increasing bike use among people who already ride regularly.
The city’s GoBoston 2030 report, adopted in 2017 and more recently incorporated into the city's climate strategy, set a goal of cutting car traffic in half by 2030, in part by increasing bicycle transportation fourfold.
Progress on meeting that goal has so far been slow. But if a relatively short segment of protected bikeways in Allston can double or even triple bike ridership in its immediate surroundings, there's hope that a comprehensive, interconnected network of similarly high-quality bike infrastructure could get the city as a whole a lot closer to its goals.
