Boston Bike Counts Make the Case for Better Bike Lanes on Key Routes
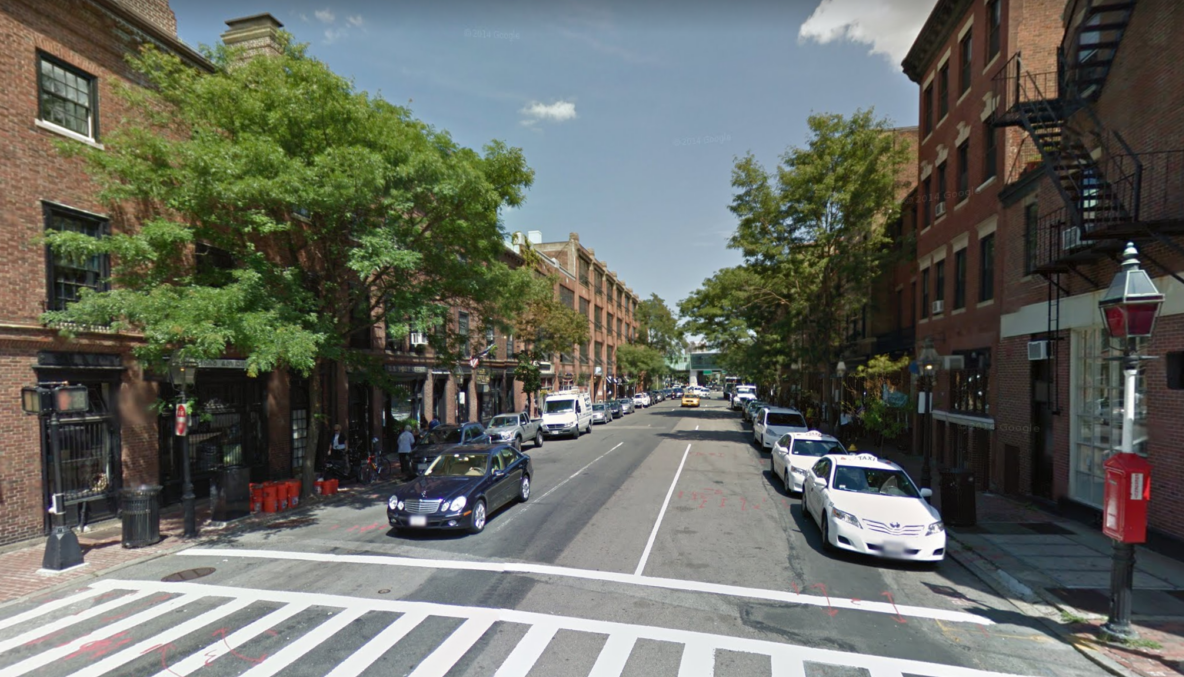
Almost one in three vehicles on Charles Street (pictured) is a bike during the morning rush hour, according to Boston’s 2019 bike count surveys.
Earlier this summer, the City of Boston published the results of its 2019 bike counts, an annual tally of bike traffic that's conducted every June and September.
And while the city is busy building new bike infrastructure in an effort to increase the number of bike trips people make across the city, the 2019 counts reveal that there's already enough bike traffic on numerous streets to justify setting aside more space for the crowds of bike riders who are already riding there, in spite of inadequate or absent bike facilities.
Since 2016, the city has deployed automated counters in early June and again in mid-September to survey bike traffic at locations across the city (the summer counts are smaller; in 2019, the September survey measured traffic in 66 locations, compared to 22 locations in June).
In both June and September, the Boston entrance to the Harvard Bridge was the busiest site for bike traffic,. Over 5,000 bikes rolled by each day during the September counts, when local universities were in session; in June, the survey counted an average of 3,873 bikes a day at the same spot.
During the peak hours of the fall counts, bikes made up roughly a quarter of all the Harvard Bridge's vehicular traffic, even though the bridge features four lanes for cars, and only two unprotected lanes for bikes.
Other count locations, though they saw less bike traffic overall, revealed even bigger disparities between the share of bike traffic and the share of roadway space devoted for safe bicycle travel.
In downtown Boston, Cambridge Street, a notorious four-lane traffic jam leading to the Longfellow Bridge, saw over 400 bikes weaving among the stopped cars during the morning and evening peak hours last September – bikes were 14 percent of the street's vehicular traffic in the morning, and 17 percent in the evening. Zero percent of Cambridge Street's roadway space is currently set aside for bike lanes, although the street has been a focus of the ongoing Connect Downtown plan.
But the biggest mismatch between bike traffic and street design might be on Charles Street through Beacon Hill, where commuters pour into the city from the Longfellow Bridge. There, at a count location near Revere Street, two to three bikes per minute rolled by during the morning rush hours – nearly one out of every three vehicles – on a street that features three lanes for moving vehicles, two for parked cars, and (with the sole exception of a Bluebikes dock) no space for bikes.
While the maps above focus on inner-city count locations where bike traffic is heaviest, the city also surveys several locations in Dorchester, Mattapan, Roxbury, and Roslindale, plus one count location each in Charlestown (near Sullivan Square) and East Boston (on Meridian St. near the McArdle Bridge to Chelsea).
As of 2019, those streets generally had lower numbers of bikes, and bike traffic generally makes up less than 5 percent of total vehicular traffic – but, with plans for better bike infrastructure in the works along corridors like Cummins Highway, Warren Street, and Blue Hill Ave., it will be interesting to see how those numbers change in future counts.
Read More:
Stay in touch
Sign up for our free newsletter