Guest Column: Yes, Transit and Dense Urban Places Are Safe – Even In a Pandemic
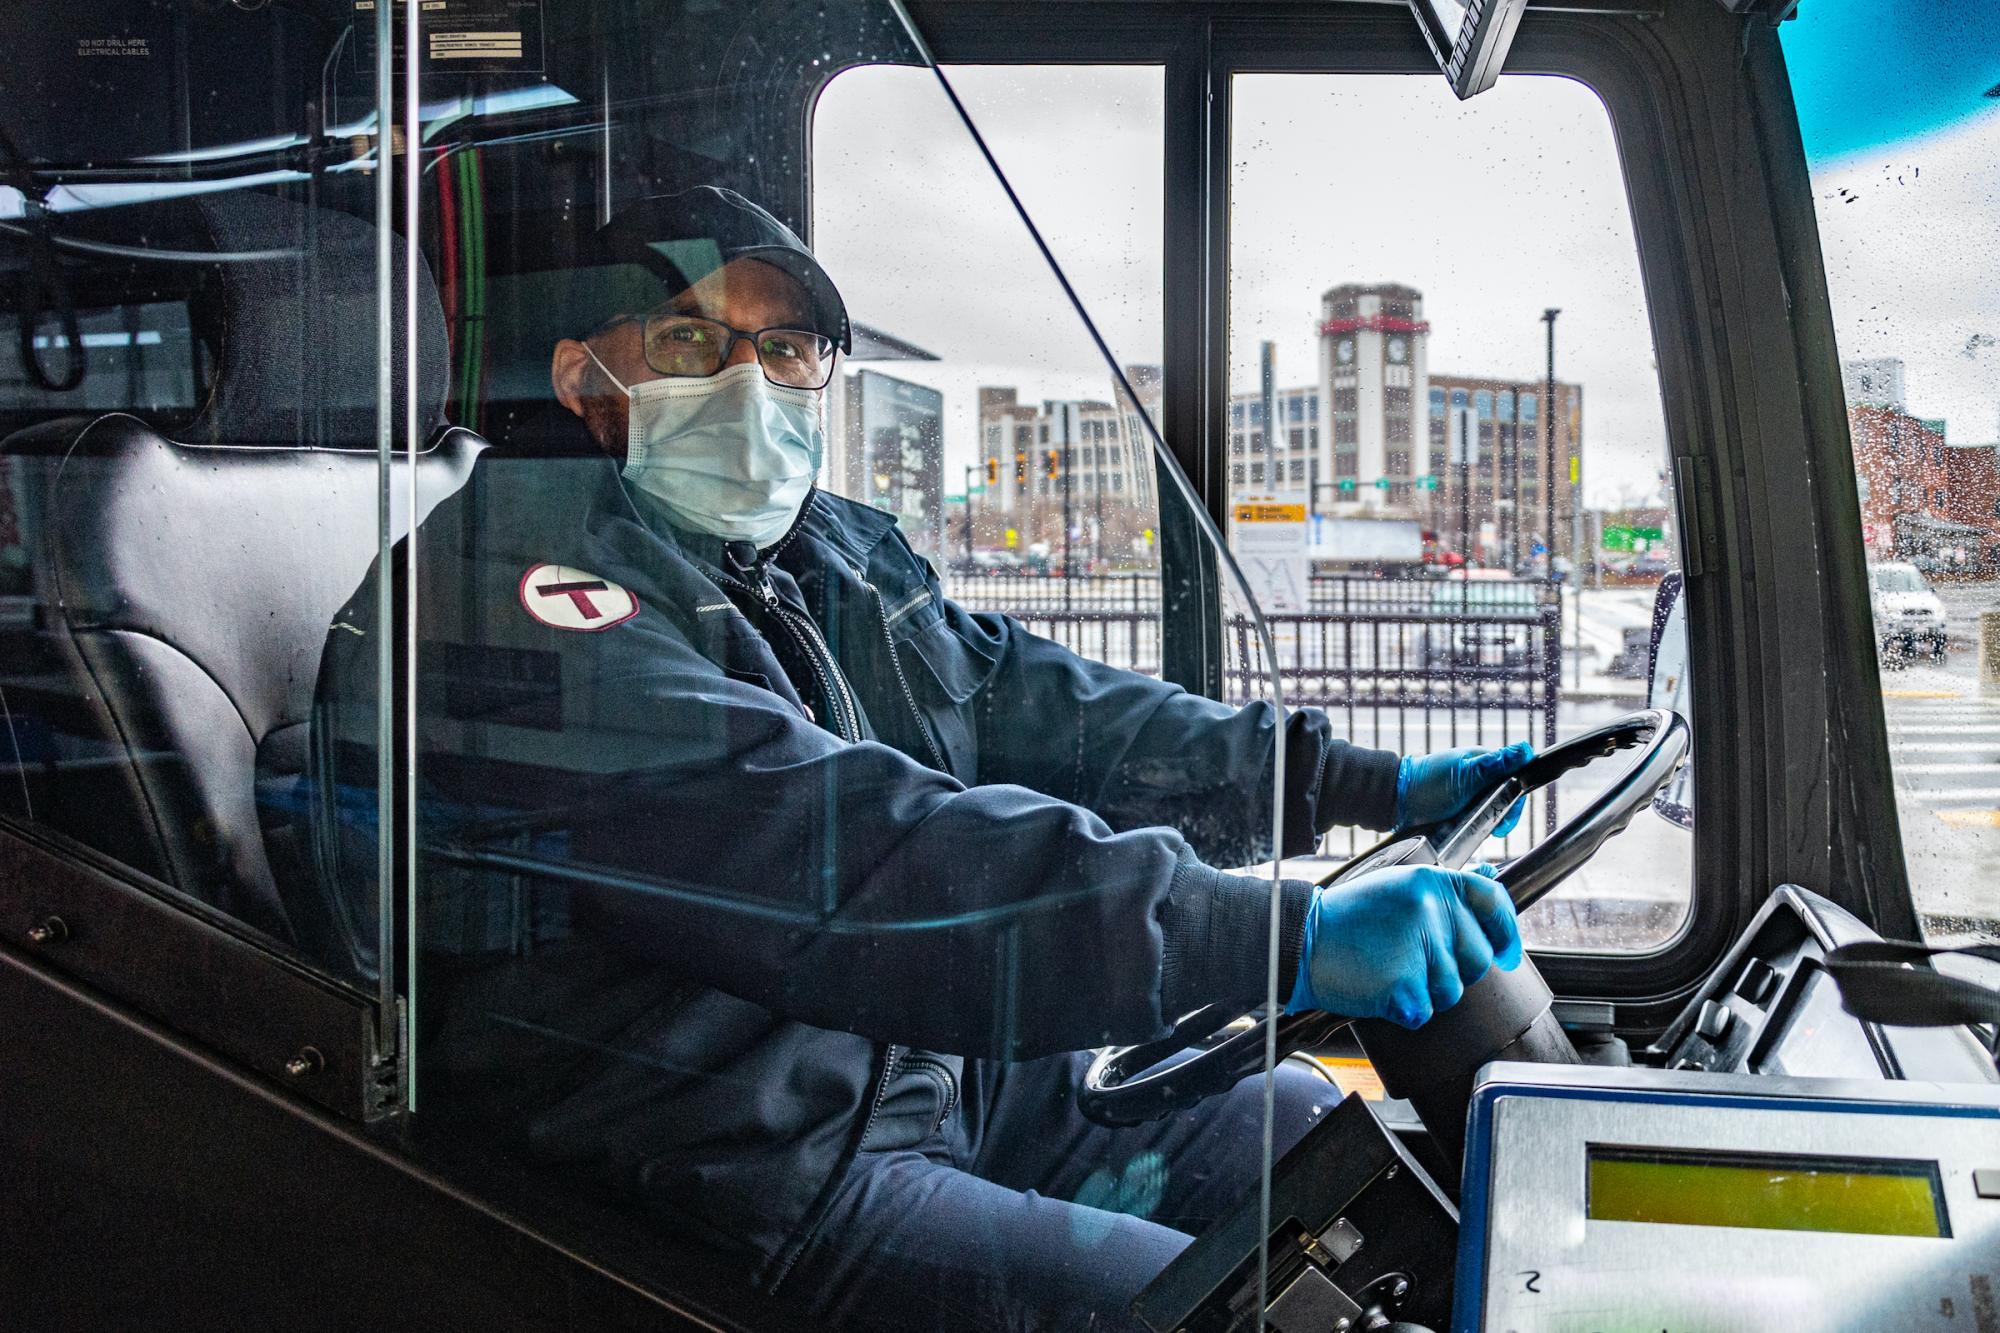
A bus driver at Sullivan Square. Courtesy of the MBTA.
At the beginning of March, as COVID-19 began spreading in large cities and the virus was still poorly understood, some academics and elected officials suggested that the density of cities – and their public transit systems in particular – were inherently unsafe during a pandemic.
Six months later, after the pandemic has torn through suburbs and rural areas, and many large cities (especially overseas) have successfully brought the virus under control, it’s clear that urban density is not the only factor in spreading the new coronavirus.
But another factor – crowding within households, which disproportionately affects lower-income and historically marginalized communities in big cities and rural areas alike, is a real culprit – and it’s something that policy makers have some control over when considering housing and transportation policies.
To start, we must clarify the difference between urban density and crowding. Understanding this distinction will als help inform the policy debates regarding safety on public transit.
Density vs. Crowding
Density describes the number of people living within a certain land area (typically expressed in terms of people per square mile or square kilometer). Crowding, on the other hand, is defined as the number of housing units that have one or more people per room, excluding kitchens and bathrooms. This metric is known as the persons-per-room measure of crowding, and it is the most commonly used definition in the United States.
Increasing evidence suggests that crowding, not density, is what contributes to the spread of COVID-19. Globally, hyper-dense Asian cities have not necessarily had the highest number of COVID-19 cases. In fact, a World Bank analysis of cities in China found that those with the highest population densities such as Shanghai and Beijing had fewer COVID-19 cases per 10,000 people than Chinese cities with relatively lower population densities.
Here in the United States, COVID-19 outbreaks have spread to less-dense rural and suburban areas. Increasing evidence regarding COVID-19 transmission points to the role of social networks, workplaces, and crowding in homes – all of which have little relation to density’s people-per-square mile measurements.
Crowding in homes – which is more likely to occur among lower-income households and historically marginalized racial groups – has been found to be one of the main factors correlated with COVID-19 transmission.
As Doctor Mary T. Basset, the director of the FXB Center for Health and Human Rights at Harvard, articulated in a New York Times op-ed, deaths in New York City from COVID-19 were primarily concentrated in crowded ZIP codes that have high percentages of Latino and Black residents. Further, these residents were dying at twice the rate of white residents in the city. In San Francisco, 50% of COVID-19 cases have been found in Latino residents, who comprise only 15% of San Francisco’s population and are much more likely than other demographic groups to live in crowded households.
This trend holds both in San Francisco and in national studies on household crowding. These alarming trends should not surprise anyone. Overcrowding has been linked to health conditions such as asthma, malnutrition, and even vitamin D deficiency. Further, in a crowded household, implementing social distancing guidelines is much more challenging when and if a household member becomes sick, as that family member is less likely to have access to their own bedroom and bathroom which could mitigate spread. In Massachusetts, poor ventilation in older housing units and high rates of environmental pollutants can further exacerbate this respiratory illness.
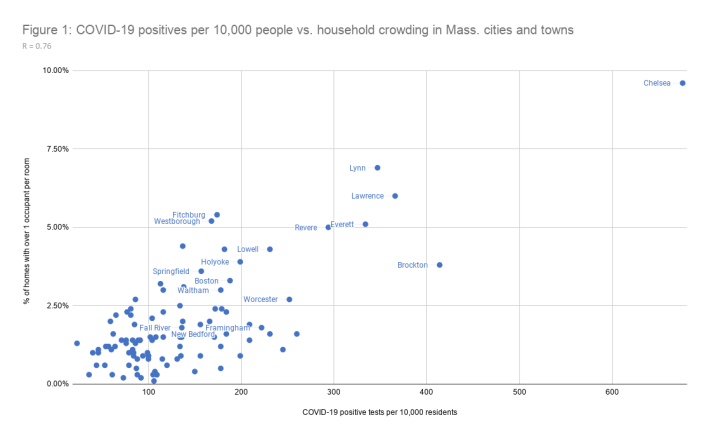
Looking specifically at Massachusetts, the UMass Donahue Institute has been testing for relationships between factors such as the share of people of color in the community, poverty rate, density, and crowding with COVID-19 cases. Their analysis, partially replicated in Figure 1 below, found that the strongest relationship between any factor and positive COVID-19 cases was crowding (R =0.76: the closer the number is to 1 or -1, the stronger the relationship). Restricting this analysis to just the 26 Gateway Cities finds an even stronger link between COVID-19 cases and crowding (R=0.84).
These findings are fascinating, but they are more meaningful when we investigate who the individuals living in overcrowded households are. As previously noted, these individuals are more likely to be Black or Latino residents. These individuals are also more likely to be transit-dependent or frontline workers.
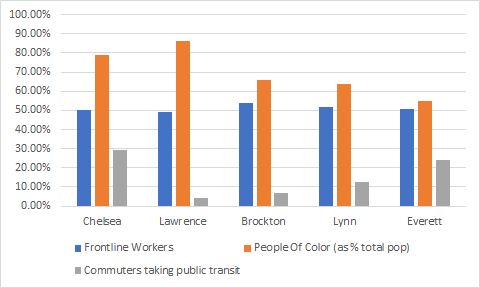
Among the 5 Massachusetts Gateway Cities with the most COVID-19 cases per 10,000 people, over 50 percent of each city’s population are people of color, and nearly 50 percent of each city’s workforce consists of frontline workers (Figure 2). Acknowledging the household conditions of essential workers is crucial for when one starts to look at the state of public transportation over the past few months.
Figure 2: Demographic Data for Gateway Cities with the most COVID-19 cases per 10,000 people as of July 8, 2020
The State of Public Transit
The experience of the past six months also suggests that public transit is relatively safe. In Tokyo and Paris, no cases of coronavirus were linked to public transit use during the month of May. The study suggests that cultural norms, such as more diligent mask wearing and limited conversations on transit, may have helped decrease the likelihood of outbreaks.
In the U.S., public transit agencies enacted procedures to physically separate riders and workers. These safety measures included back of the bus boarding to protect drivers, suspending fare policies, cleaning vehicles more frequently, and issuing crowding alerts on some bus lines.
Unfortunately, many transit workers have fallen ill from the coronavirus, including workers at the MBTA and other Regional Transit Authorities (RTAs) across the Commonwealth.
While transit operators do come in contact with many people, many are also people of color who live in crowded housing. According to one Massachusetts RTA official, the single coronavirus case their agency had was likely contracted from a spouse’s work at a nursing home, rather than from a bus.
As has been documented here in Massachusetts and elsewhere, public transit ridership levels dropped dramatically during the spring. In April, ridership on the MBTA Commuter Rail was down 90%. On the MARC commuter trains from Baltimore to Washington DC, ridership was down 94%. Even New York City’s MTA had ridership fall 80% on the subways and 70% on the bus system.
But, while these numbers on their face might be frightening, not all transit agencies experienced the same ridership patterns.
Evidence from Regional Transit Agencies here in Massachusetts serving some of the Gateway Cities points to a rebound in transit use and more sustained use than on the MBTA (Figure 3). On many RTAs, transit has maintained more consistent use likely because the individuals who rely on these services tend to be essential workers, transit dependent, low-income, and people of color.
Figure 3: 14 day moving average of proxy ridership levels March 1, 2020 – June 30, 2020
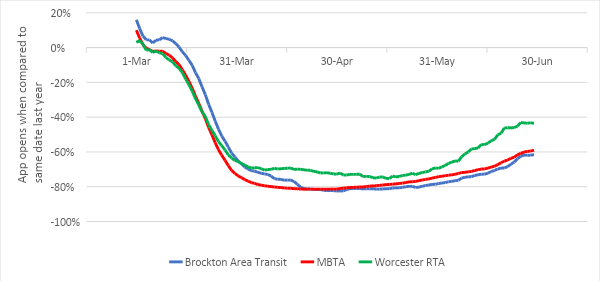
As Figure 3 shows, ridership levels and trends for all transit agencies in the Commonwealth have not been equivalent. For example, MBTA demand during March fell faster than on both Brockton Area Transit (BAT) and Worcester RTA. On April 5 for example, real demand was down 75% on the MBTA, as opposed to a drop of 69% on BAT, and only down 56% on Worcester RTA. These statistics demonstrate that many MBTA riders may be more able to work from home or use other modes of transit to commute.
In contrast, the slower and less sustained drop among the other agencies highlights that these riders are more transit-dependent, and thus more reliant on RTA services to transport them to work and to essential services, such as the grocery store.
Evidence from Montachusett RTA ridership (not shown in the figure) for March through May found that fixed-route ridership only dropped 57% when compared to 2019 levels. Although this drop in ridership is certainly large, it is not as large as the decrease on the MBTA as a whole and, most specifically, MBTA commuter rail.
Another interesting trend to note from Figure 3 is the relatively horizontal section of the graph spanning from the middle of April through late May. This trend could reflect the share of essential workers that each agency serves. According to Transit Center, their analysis of 2018 U.S. Census data found that roughly 36% of essential workers use public transit to commute each day. Given that ridership levels across BAT, the MBTA, and Worcester RTA stalled between 65% and 80% for much of April and May, the data here in Massachusetts seems to match those broader national findings and shows that public transit has been an essential service during this pandemic.
In conclusion, the evidence suggests that crowding in homes (and occasionally in workplaces) is more closely linked with the spread of COVID-19 than urban density or public transit use. Furthermore, crowding particularly affects people of color and frontline workers.
This evidence has two pertinent conclusions as we look towards the future: first, public transit is an unlikely vector for the spread of disease; rather, it remains an essential and safe service that our elected officials must continue to support.
And second, to address the more serious issue of residential crowding, cities should embrace transit-oriented housing and compact, walkable neighborhoods to help ensure that all households have the space and access to transportation that they need to thrive.
In spite of the pandemic, the future of dense, walkable, transit-oriented cities remains bright.
Nina Weiss is a junior at Johns Hopkins University studying Sociology and International Studies. In summer 2020, she worked as an intern for MassINC's Transformative Transit-Oriented Development Initiative under the direction of TOD Fellow Dr. Tracy A. Corley.
Dr. Tracy A. Corley has led economic development, sustainable land development, and clean technology initiatives and research across the U.S. and in Germany. She is also a lecturer in the School of Public Policy and Urban Affairs at Northeastern University.
Stay in touch
Sign up for our free newsletter