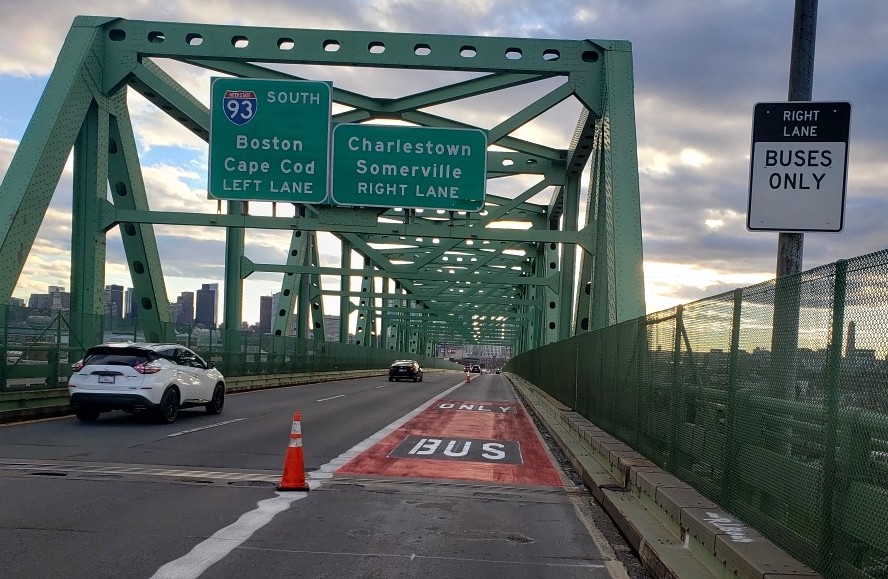
Morning rush-hour commutes on the Tobin Bridge are significantly faster since MassDOT took away one highway lane from private automobiles to install a dedicated bus lane into downtown Boston, according to MassDOT travel time data.
The faster travel times support a key argument for bus lanes: that by setting aside scarce roadway space to benefit more efficient forms of transportation, governments can reduce traffic and make infrastructure work more efficiently for everyone.
A pre-pandemic analysis of trips on the Tobin Bridge – before the bus lane existed – found that the median bus trip suffered 10.6 minutes of delay on the bridge and its approach ramps, or 4.4 minutes per mile.
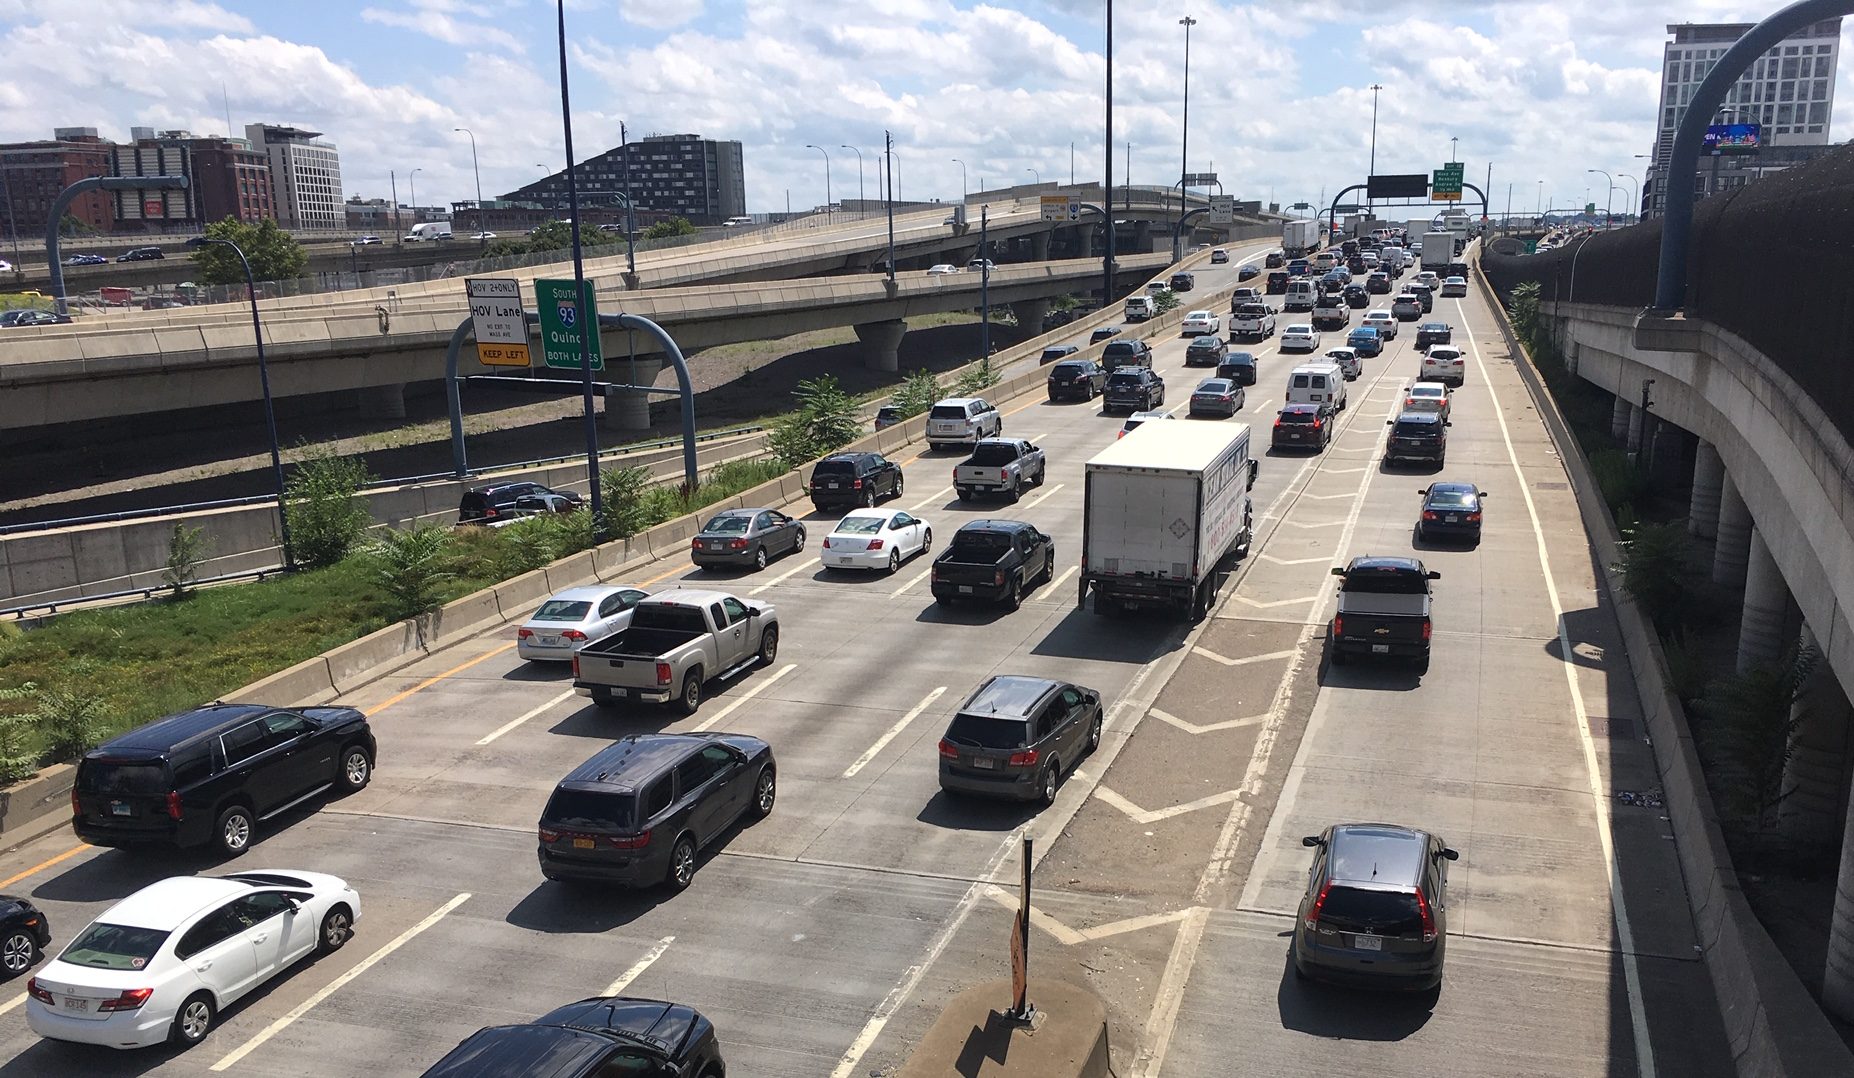
A subsequent 2023 analysis of drivers' cellphone location data on a longer but overlapping segment of the Route 1 highway concluded that the average delay for motor vehicle traffic during the 8 a.m. rush hour was 3.8 minutes per mile this spring.
That means that car trips across the Tobin Bridge from the Everett Avenue on-ramp to the City Square off-ramp in Charlestown are roughly 40 seconds faster during the morning rush hour than they were before the bus lane existed.
About 2,792 vehicles use the Tobin Bridge during the 8 a.m. rush hour, so the faster travel times on the bridge add up to a collective savings of over 28 hours every weekday.
Other highways without new bus lanes didn't see similar benefits
The pre-pandemic travel time data came from a 2019 MassDOT study that aimed to prioritize potential new bus lanes on state-owned roadways.
The study analyzed bus trip travel times on the 2.4-mile segment of Route 1 between the Arlington Street on-ramp in Chelsea and the Rutherford Ave. off-ramp in Charlestown (note that the 111's route has since been changed to use the Everett Ave. on-ramp instead).
At the time, without a dedicated bus lane, the median inbound bus ride across the Tobin Bridge suffered from 10.6 minutes of congestion-related delays (or 4.4 minutes per mile).
Buses shared the same travel lanes as every other vehicle on the bridge at that time, so this a reasonable measure for the delay that any other driver would have faced at the time.
Some of the reduction in traffic delays since 2019 could be credited to changing travel patterns in the wake of the pandemic. Most of the region's major highways have seen small improvements in travel times.
But of the four major highways leading into downtown Boston, Route 1 southbound has seen the biggest reductions in travel times compared to 2019, according to a March 2023 presentation to the MassDOT Board of Directors:
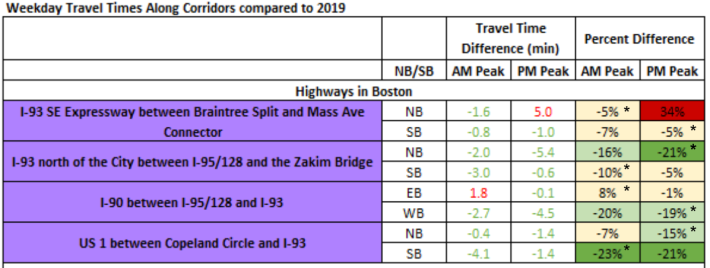
Note how the northbound direction of Route 1 – where there's currently no bus lane in place – saw markedly smaller reductions in travel times, in both morning and evening rush hours.
Transit riders gain the biggest benefits
Of course, the benefits of the new bus lane are especially pronounced for the riders of the Route 111 buses and several other privately-run intercity bus routes that now have a shortcut around some of Route 1's congestion.
"The Tobin Bridge bus lane are speeding up bus trips for over 9,000 bus riders per day on Bus Route 111 (May 2023, typical weekday)," wrote Wesley Edwards, the MBTA's Acting Chief of Operations Planning, Scheduling, and Strategy, in a June 14 email to colleagues at MassDOT and the MBTA.
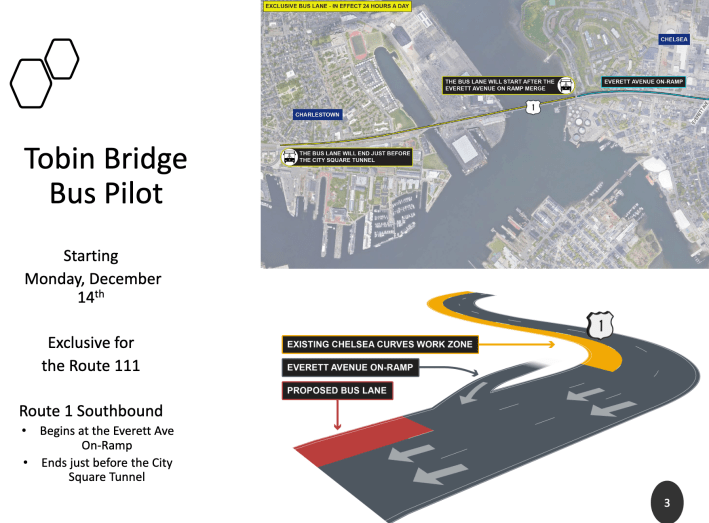
"Before the inbound lane was installed, buses took 16 minutes on average to cross the bridge at peak times, and up to 5-10 minutes more on top of that due to congestion (90th percentile running times)," continued Edwards. "With the lane today, buses cross the bridge in about 5 minutes."
And, because most of that time savings benefits transit-dependent workers living in Chelsea, the new bus lane helps reduce historical patterns of racial inequities in the MBTA's transit network.
According to a 2022 rider survey, 71 percent of Route 111's riders identify as non-white, and 54 percent come from low-income households.
"80 percent of Chelsea's population work in occupations deemed 'essential' and many people rely on the 111 to commute into Boston for these jobs. It is imperative for the 111 to provide consistent and reliable service for these workers," wrote Camilo Auyero, a transit justice community organizer for Chelsea-based GreenRoots, in an email to StreetsblogMASS.
Some notes on the data
StreetsblogMASS obtained these data from a June 2023 public records request for MBTA and MassDOT emails and other correspondence mentioning the Tobin Bridge bus lane.
The records included a Microsoft Excel spreadsheet of traffic data from May 2023. In a follow-up email message, MassDOT also provided a spreadsheet of data from their 2019 analysis of bus delays. You can view those spreadsheets here.
The 2019 and 2023 analyses of congestion delay adopted slightly different ways to analyze and report their data, but those differences likely understate the actual changes in travel times that people experience.
If you don't care to get into the weeds about these data, feel free to stop reading here, because the rest of this article is devoted to getting into those weeds.
One key difference: the 4.4 minutes/mile of delay in the 2019 report was the median level of delay – that is, half of all trips were faster, and half were even slower.
The 2023 MassDOT analysis, which reported 3.8 minutes of delay per mile, was the average delay on Route 1 between Copeland Circle and I-93.
To illustrate the difference with an example, imagine a trip that takes 10 minutes four days a week, but takes 20 minutes every Friday. In that scenario, the median trip length would be 10 minutes, but the average trip length would be 12 (10+10+10+10+20, divided by 5).
If traffic delays follow a so-called "normal" distribution – i.e., if deviations from the average on either side are equally likely in probability – then there would be minimal difference between the mean and the median.
In reality, though, traffic delays have a "skewed" distribution by virtue of the fact that while there's a strict lower limit to the amount of delay you might encounter (i.e., zero delay), there's essentially no limit to the amount of delay people might encounter on the high end.
If the distribution of traffic delays on the Tobin Bridge is indeed skewed – i.e., if the probability of a commute that's 10 minutes longer than usual is greater than the probability of a commute that's 10 minutes quicker than usual – then the average delay in 2019 was likely higher than the median 4.4 minutes/mile that MassDOT reported at the time. Conversely, the median delay in 2023 would have been lower than the average of 3.8 minutes/mile reported in MassDOT's more recent analysis.
Another difference: the 2023 data came from anonymized cellphone data from INRIX, which analyzed trip times on the 5-mile segment between Squire Road and I-93. The 2019 study of bus delays looked specifically at MBTA bus travel times on a shorter but overlapping segment on the Tobin Bridge, between the Arlington Street on-ramp in Chelsea and the Rutherford Ave. off-ramp in Charlestown.
The 2019 study, which analyzed trips on the 2.4-mile segment of the bridge and its approach ramps, found 4.4 minutes per mile of delay without the bus lane in place. The 2023 INRIX data, which analyzed trips on the longer 5-mile segment of Route 1 between Revere and Charlestown, found an average of 3.8 minutes/mile of delay.
However, the 2023 number likely overstates the level of delay on the bridge itself. Screenshots from Google Maps traffic reports indicate that the worst congestion on Route 1 during the morning rush hour is consistently not on Tobin Bridge, where the bus lane is, but on the curves north of the bridge, between downtown Chelsea and Revere.
In other words, the typical delay-per-mile on the bridge itself is likely lower than the delay-per-mile on the longer segment of Route 1 north of the bridge.
MassDOT was not able to provide median travel time data for the shorter segment of Route 1 on the Tobin Bridge itself to allow for a direct apples-to-apples comparison of pre-pandemic and post-pandemic travel times.
